What the Predicted La Niña Means for the United States
ContactRelief Consulting Meteorologist Dr. Kevin Levey looks this winter's predicted La Niña and what is means for the United States.
Thursday, 02 November 2017 08:00:00 -05:00
A weak La Niña is predicted this winter. What does this mean? What is La Niña? How does it affect the weather of the United States? All very common questions as the National Weather Service issued their winter outlook for the US this past week. Let’s look briefly at what La Niña is.
La Niña is an ocean event and is the opposite of the better known El Niño. Sea-surface temperatures (SST) are measured in specific areas of the Pacific Ocean along the equator as shown in figure 1 below:
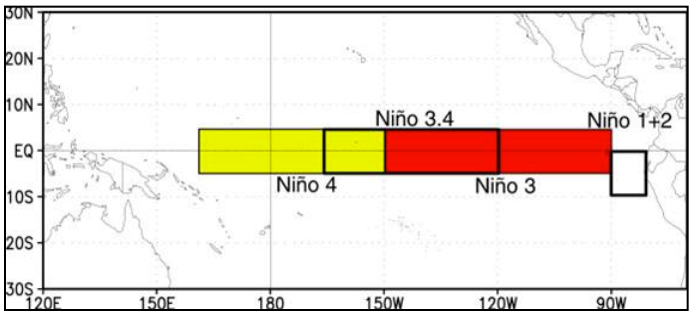
These sea-surface temperatures are averaged over three months and then compared with the expected average sea-surface temperature. The 3-month running mean departures from normal are referred to as the Oceanic Niño Index and is the standard used by NOAA for identifying El Niño (warm) and La Niña (cool) events in the tropical Pacifica Ocean, and more specifically, for the Nino 3.4 region shown in Figure 2 above. EL Niño or La Niña events are defined as five consecutive overlapping 3-month periods at or above the +0.5°C anomaly for warm (El Niño) events and at or below the -0.5°C anomaly for cold (La Niña) events. The threshold is further broken down into Weak (with a 0.5°C to 0.9°C SST anomaly), Moderate (1.0°C to 1.4°C), Strong (1.5°C to 1.9°C) and Very Strong (= 2.0°C) events. The forecast for the December-February period is about -0.7°C, which puts it in the “weak” category.
Atmospheric circulation patterns are affected by changes in SST in the tropics, therefore, both La Niña and El Niño affect circulation patterns, not just in the tropics, but all around the planet. Figure 2 below shows broadly how the atmospheric circulation is affected in the tropics:
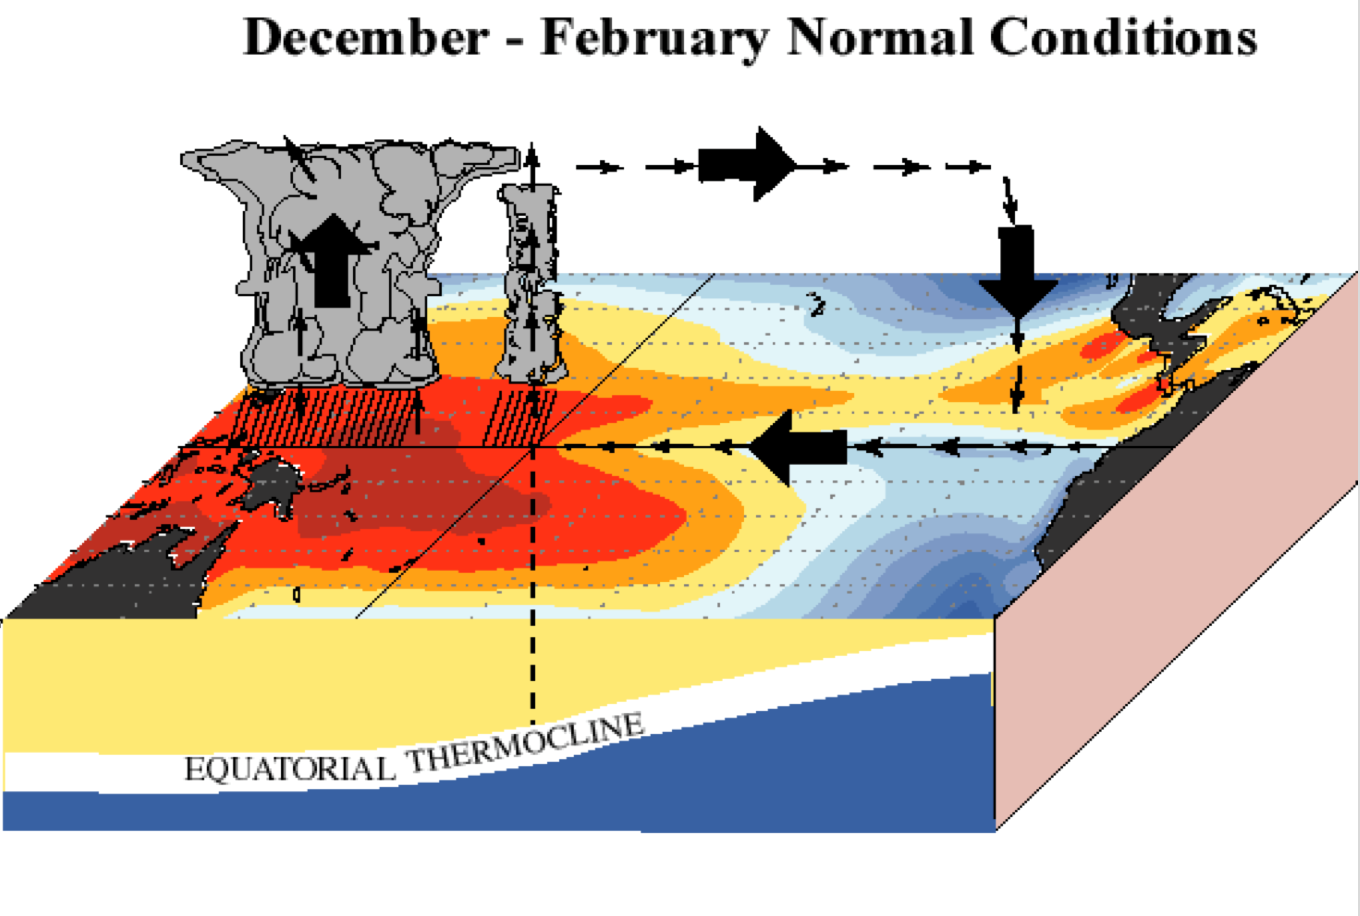
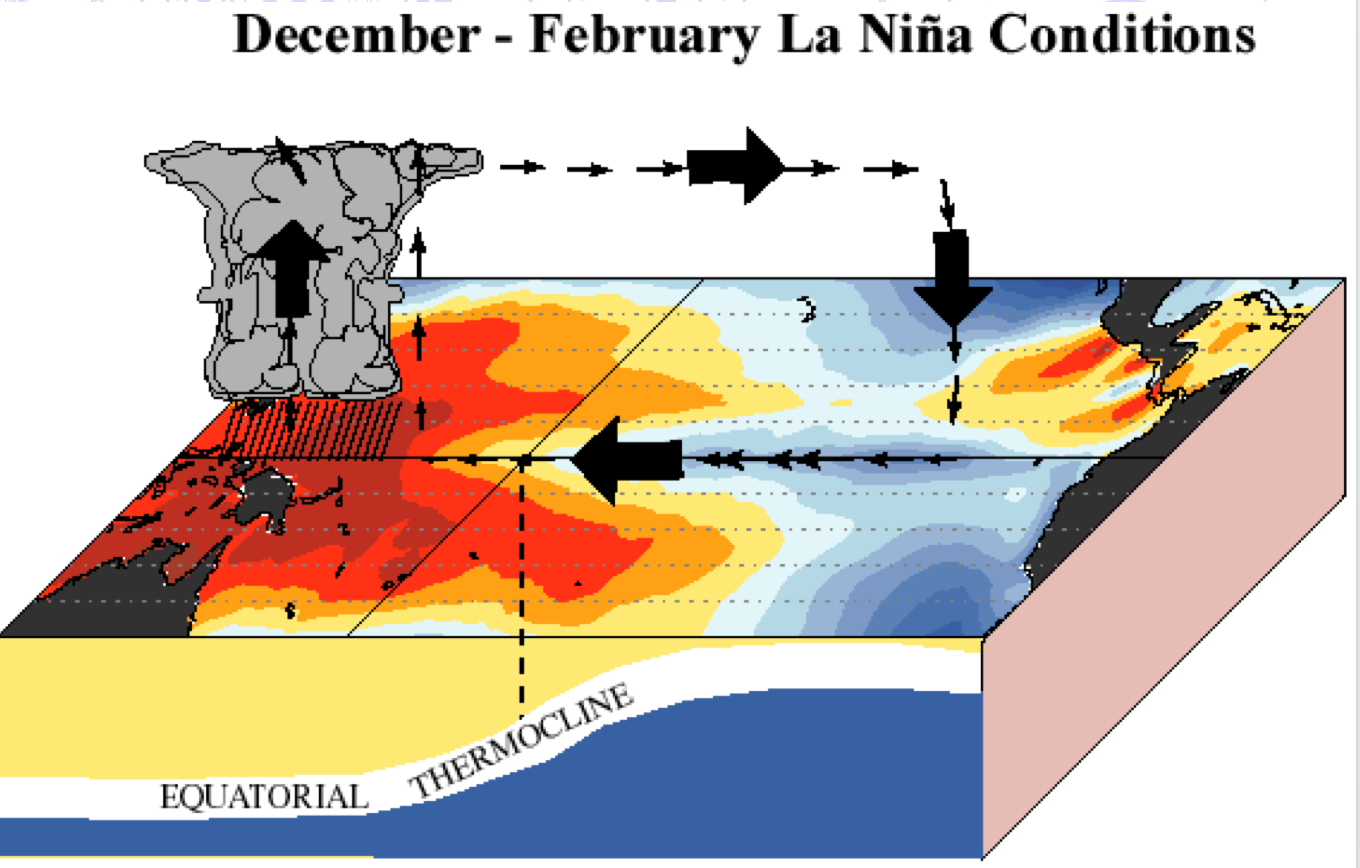
Colder than normal SSTs occur off the coast of Peru extending along the equator towards Indonesia, with stronger easterly surface winds blowing towards Indonesia, and enhanced convection over the maritime continent. More specifically, the United States is affected directly by atmospheric circulation changes brought on by La Niña and is shown in Figure 3 below:
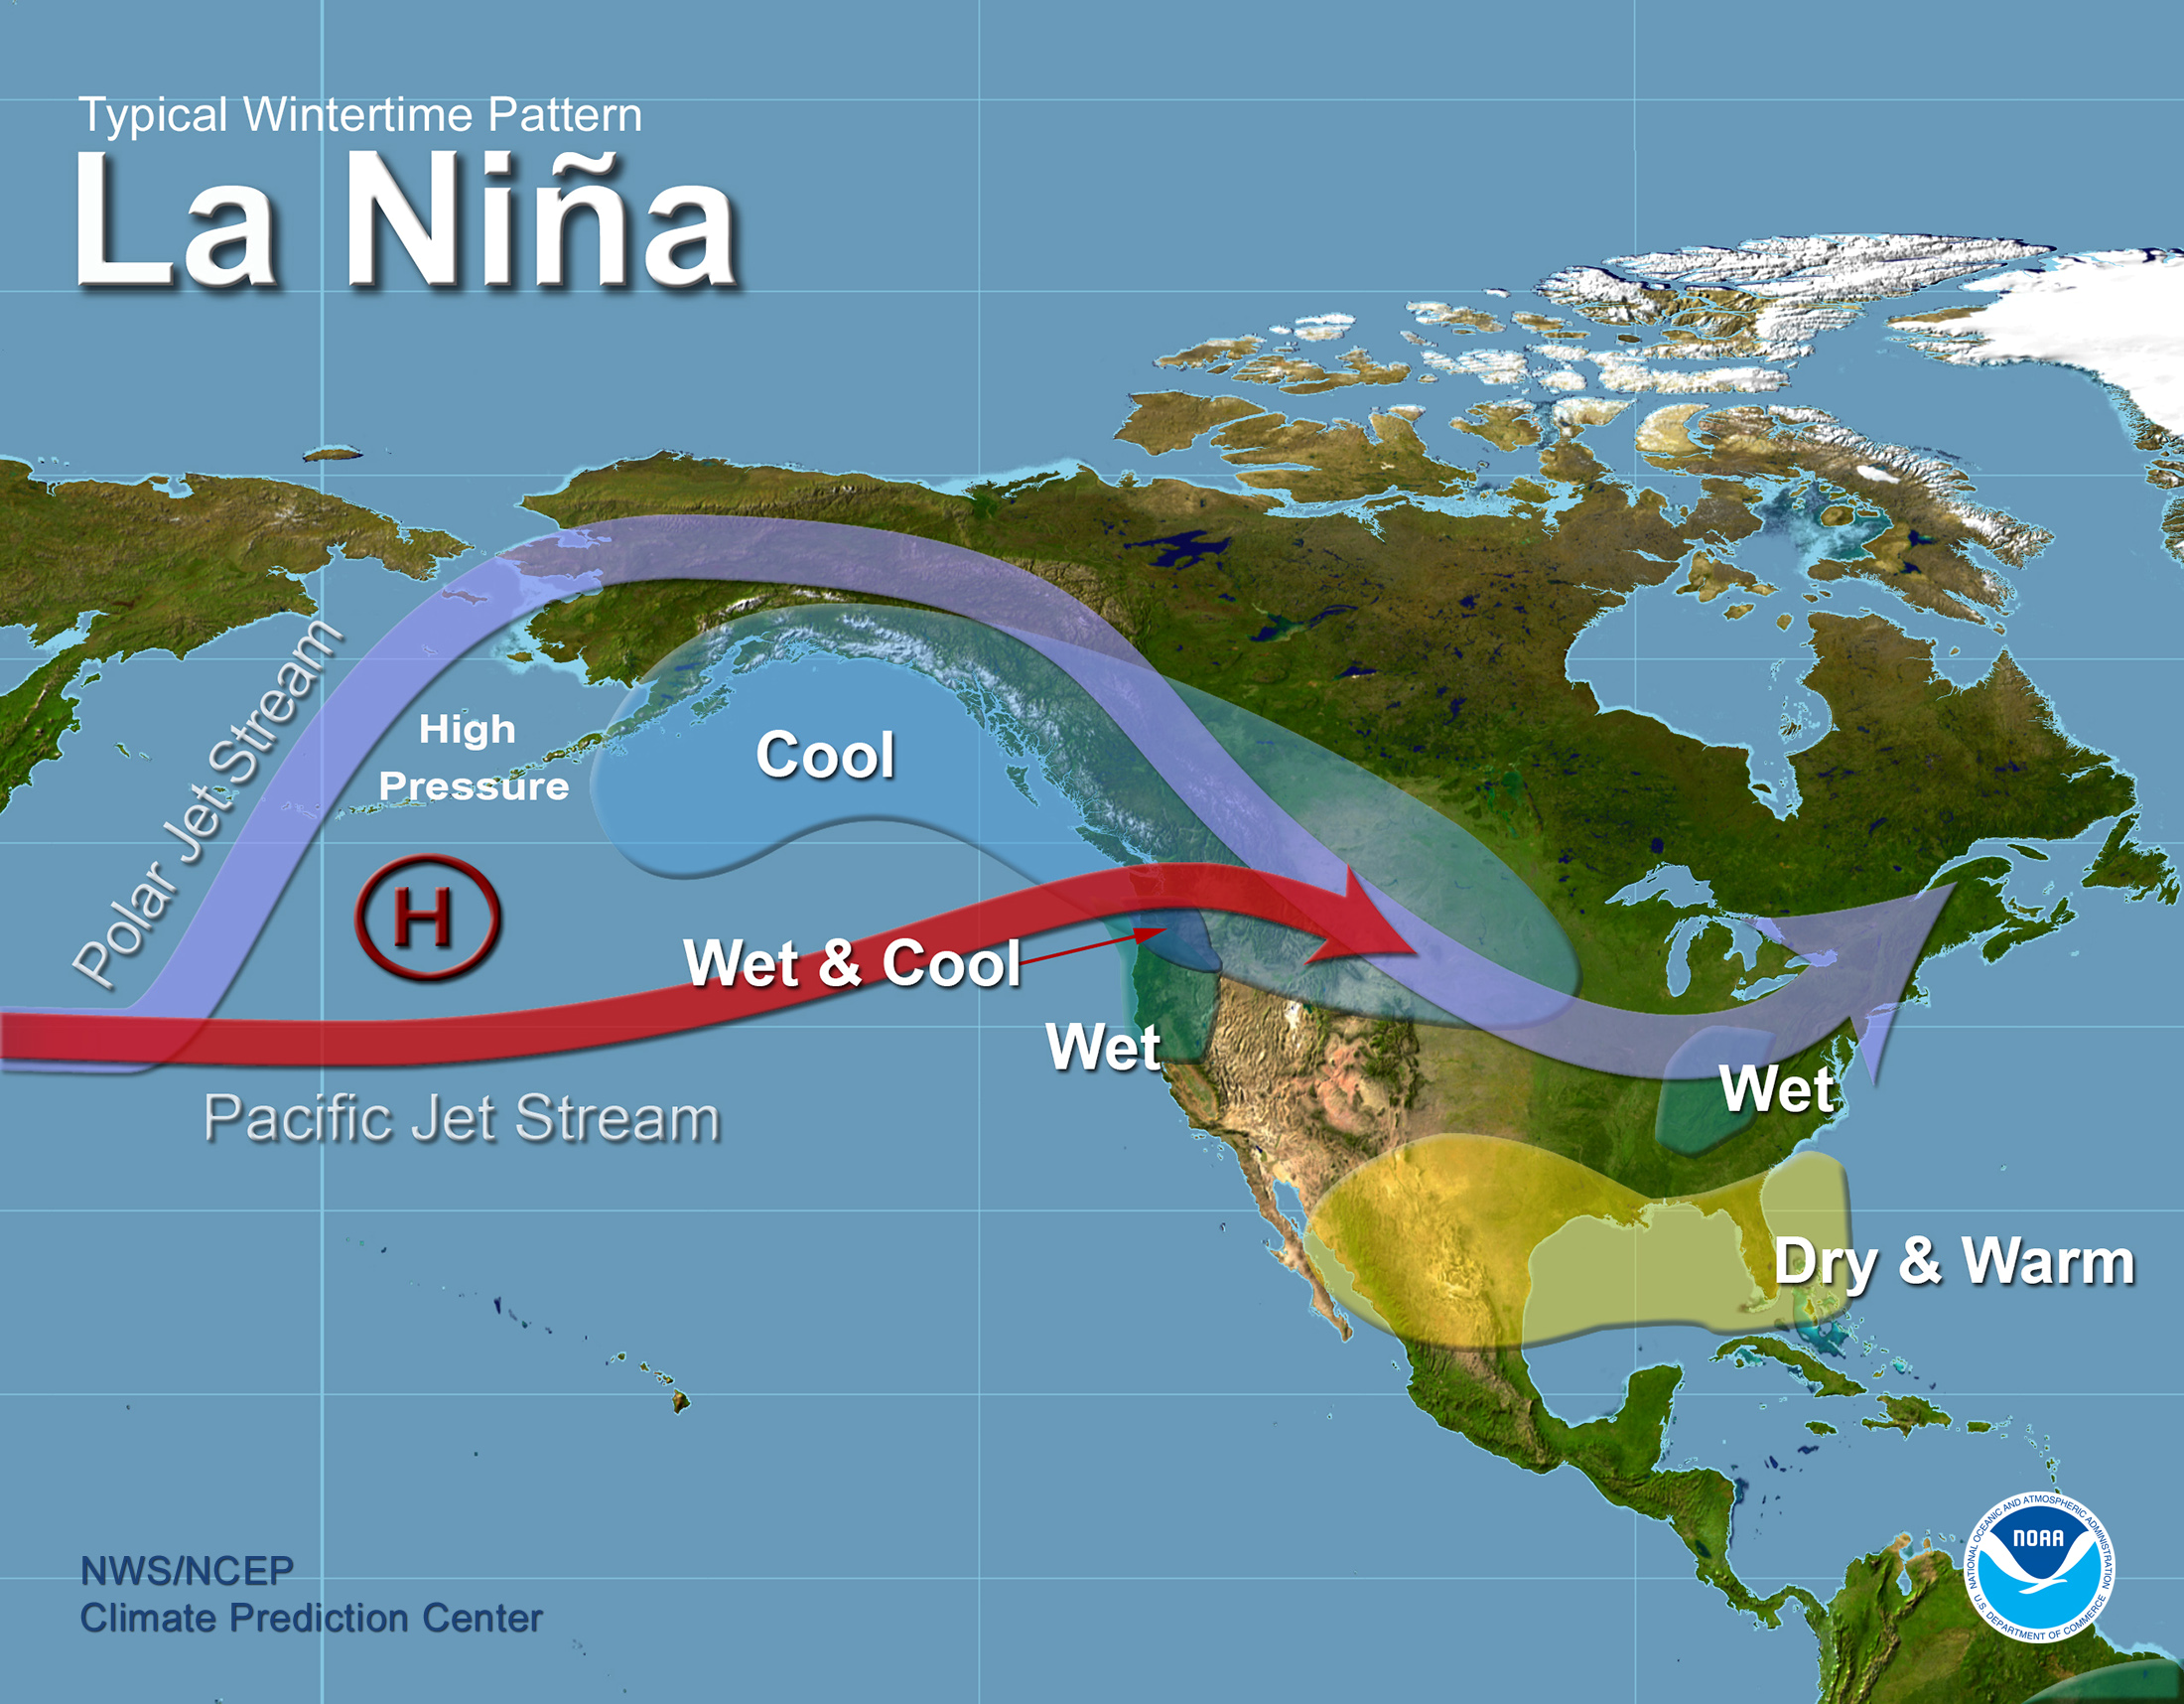
The polar Jetstream is more active over Alaska and the northern parts of the country, with generally cooler conditions and wetter over the coastal areas of Alaska, British Columbia, the Pacific Northwest and northern California. The southern tier states generally experience a milder, warmer, drier winter. The Pacific Jetstream is much more variable and is usually focused on the Pacific Northwest, but as this past winter demonstrated, it was highly focused on Northern California. The Pacific Jetstream is highly variable and we shall see below just how it can affect rainfall in California.
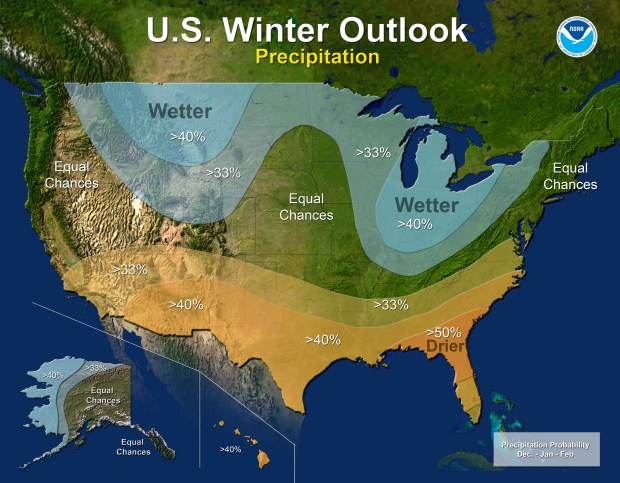
That being said, the CPC released their winter outlook as seen in Figure 4 below which pretty much mimics the expected typical winter conditions associated with La Niña.
However, meteorologist Jan Null of Golden Gate Weather Services and an expert on El Nino and La Nina’s effects on the United States warns us that no two La Niña’s are identical nor are weak and strong La Niña’s identical in their effects on the United States. Figure 5 below shows this very clearly. It shows two weak La Niña winters – one for the 2008-2009 winter and one for the past winter, i.e. 2016-2017.
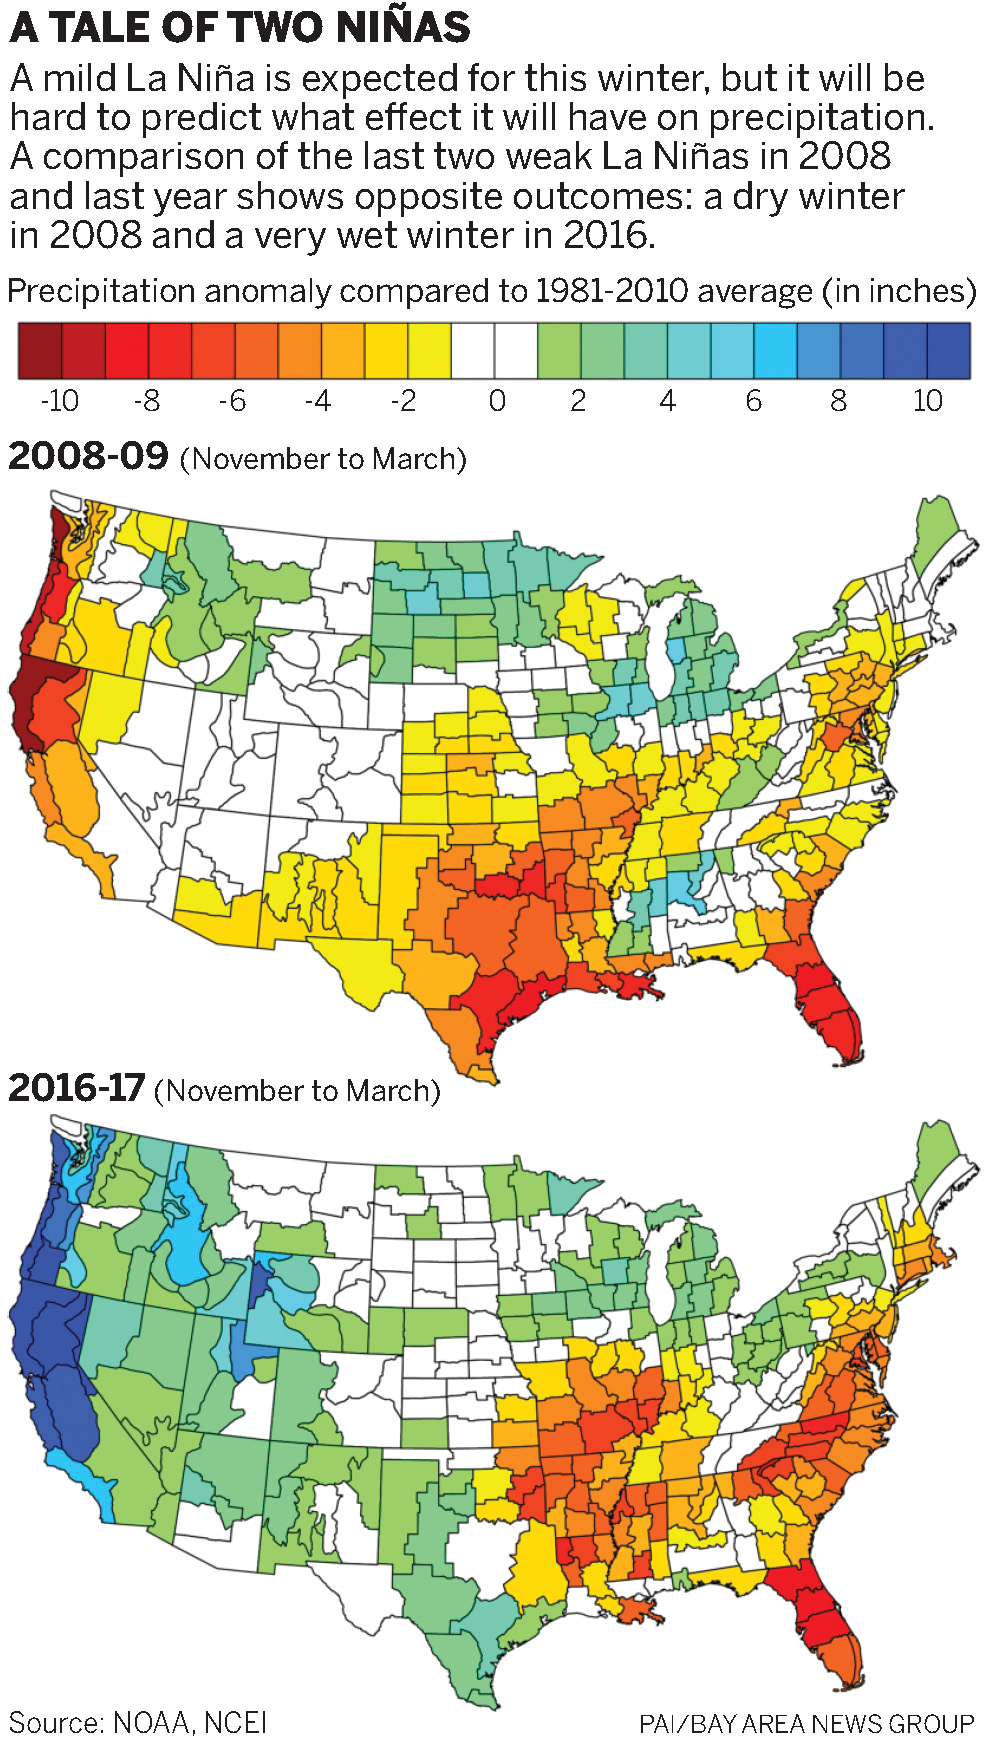
This past winter was one of the wettest winters ever recorded in California, while the 2008-2009 winter was extremely dry along the entire West Coast, including the usually “wet” Pacific Northwest. The southern interior and Florida were, however, generally much drier than normal in both weak La Niña winters (typical La Nina conditions).
Some reasons for these very different winters along the West Coast include the fact that there are other weather phenomena that affect the winter rainfall regions and California is especially susceptible to them and not to any one specific weather phenomenon. The very variable Pacific Jetstream during La Niña years is also a major factor.
NOAA’s Mike Halpert said that while a mild La Niña was on its way, it’s impossible at this point to know how that will translate on the ground. It will probably mean the winter in Southern California will be drier than normal, he said. When asked whether Northern California could see a repeat of the intense showers it saw last winter, Halpert was cautiously optimistic. “I wouldn’t expect a second year of such extreme precipitation,” he said. Then again, referring to the ‘less-normal-more’ conundrum, Halpert was clear about one thing: “We’ll see an equal chance for any of those three outcomes for the northern part of California. “Will we see what we saw last year?” he said. “There’s a very rare chance . . . but not a zero chance.”
We will definitely look back on this upcoming winter next year and see how well the forecast verifies…if at all.