The North Atlantic Oscillation
ContactRelief Consulting Meteorologist Dr. Kevin Levey explains the North Atlantic Oscillation's affect on climate.
Wednesday, 22 November 2017 08:00:00 -05:00
The North Atlantic Oscillation
Over the next few weeks I will be covering a few of the main climate variability phenomena that affect the weather over North America. There are many well documented climate variability phenomena that affect the weather over Norther America, and El Niño/La Niña is probably one of the best known. However, there are many others that affect our weather to a lesser degree. Today I will discuss the North Atlantic Oscillation (NAO) and how and when it affects the weather over the United States.
The NAO was first discovered in the 16th century when a traveler between Europe and the United states noted that mild winters in Greenland often coincided with severe winters in Denmark, and vice versa. The NAO is now recognized as this severe-versus-mild phenomenon. Air pressure over two regions in the Atlantic Ocean drive this oscillation:
- Low pressure is generally experienced at high latitudes of the North Atlantic Ocean near Greenland and Iceland and is generally called the sub-polar low.
- Further south at lower latitudes of the central North Atlantic Ocean, pressure is generally higher and this atmospheric feature is called the subtropical high.
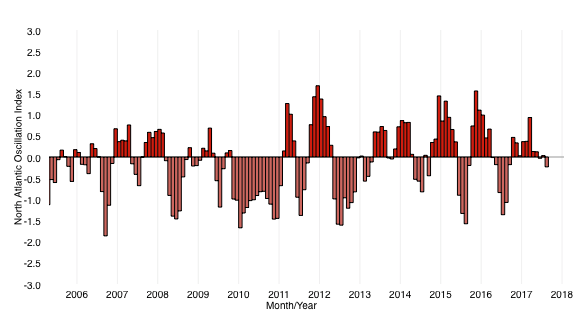
The phases of the NAO are defined by higher-than-average air pressure in one of these regions and lower-than-average air pressure in the other. The anomalous patterns directly affect weather of the North Atlantic Ocean by influencing the intensity and location of the Jetstream and the storm tracks that are driven by the Jetstream. Figure 1 below shows NAO index since 2005.
NAO positive phase: The NAO is said to be in a positive phase when both the sub-polar low and the subtropical high are stronger than average. As shown in Figure 2 below, this results in a stronger-than-average Jetstream and a northward shift of the storm track. The eastern United States often sees a wetter pattern with stronger storms during the winter season in this phase due to increased upper level winds and above average temperatures.
NAO negative phase: The NAO is said to be in a positive phase when both the sub-polar low and the subtropical high are weaker than average. As shown in Figure 3 below, this results in the eastern United States typically receiving colder, drier air masses (hence, below average temperatures and rainfall) during the winter season in this phase.
As of October 2017, the current NAO index is +0.71, however it was negative during August and September. Current forecasts show it to continue into negative territory for November, therefore implying increased chances of warmer, wetter weather along the east coast of the United States. The CAVEAT here is that there are many different climate variability phenomena that interact with each other, which can either enhance or dampen expected weather outcomes as mentioned above.
Are you prepared for the next disaster?
Disasters can strike at a moment’s notice. That’s why, at ContactRelief, we provide round the clock disaster monitoring to keep your operations ahead of disasters. With timely, comprehensive recommendations that are accurate to the ZIP code, ContactRelief ensures you focus less on the disaster, and more on your operations.
Contact sales@contactrelief.com for more information.