
2018 Hurricane Prediction Update
Meteorologist Dr. Kevin Levey looks CSU's updated hurricane prediction for 2018
Monday, 09 July 2018 19:35:00 -05:00
Tropical Outlook:
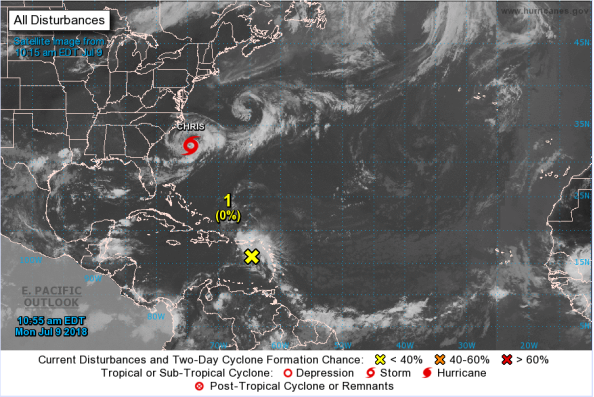
The Atlantic has become active with the formation of Tropical Storm Chris, which is currently lingering just to the east of the South Carolina coastline, as seen in Figure 1. As of 5:00 PM EDT Monday, Tropical Storm Chris is nearly stationary with maximum sustained winds of 60 mph.
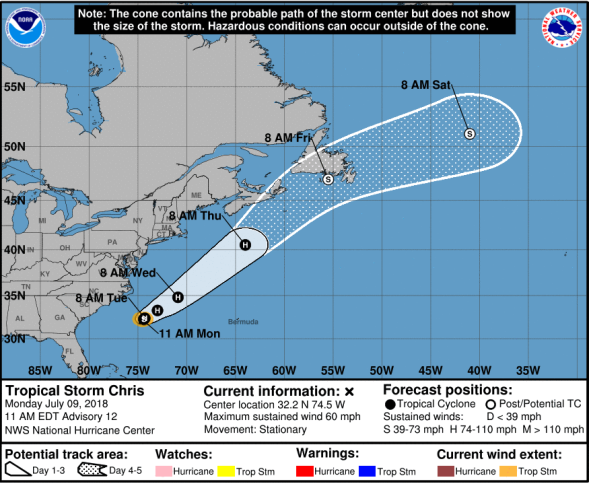
Chris is forecast to strengthen today and will likely become the second hurricane of the 2018 season as it lingers off the eastern coastline. Fortunately, Chris is forecast to stay out to sea during the remainder of its lifespan, as it is expected to begin moving northwestward later today and parallel the U.S. East Coast over the next few days. No impacts besides heavy surfs are expected along the east coastline during this time period. (See Figure 2 below for track).
Elsewhere in the Atlantic, the remnants of Hurricane Beryl are currently located in the far-northeastern Caribbean Sea. Beryl became the season's first hurricane late last week, however, the storm quickly weakened and dissipated as it approached the eastern Caribbean islands. The remains of this storm are expected to track northwestward and then northward over the next few days, and will most likely follow the same path as Tropical Storm Chris late this week. Even if redevelopment of this storm were to occur, there is a near-zero probability that Beryl will have any impacts anywhere along the U.S. coastline.
Revised Atlantic Hurricane Season outlook!
Colorado State University (CSU) let by Dr. Phil Klotzbach and Dr. Michael Bell have revised their Atlantic hurricane Season outlook. The bottom line is that they are now calling for a total of 11 named storms, 4 hurricanes, and 1 major hurricane for the season, including the named storm we’ve already had (Alberto). This is a major downgrade from the outlook issued on May 31, which had been calling for 14 named storms, 6 hurricanes, and 2 major hurricanes. The amount of accumulated cyclone energy (ACE), which takes into account both intensity and duration of each cyclone, is now projected to be 60 for the Atlantic season— only about two-thirds of its typical value for the period 1981-2010. The main culprits causing this major downwards revision:
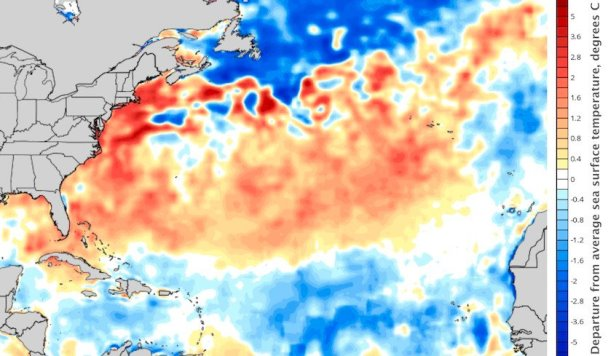
- Colder than average sea surface temperatures in the eastern North Atlantic Ocean (see below in Figure 3)
- and a growing possibility of weak to moderate EL Niño later this year.
According to Klotzbach, he doesn't see any way that this season would end up being active at this point as a result of the Atlantic Ocean being colder than normal and enhanced wind shear in the Caribbean region as El Niño returns this year. (Wind shear or strong winds in the upper levels of the atmosphere are not conducive for hurricane development).
CSU’s early July outlook was introduced in 2016 based on a fairly simple but quite effective statistical technique that relies on just two factors:
- the May-June sea surface temperature (SST) across the eastern North Atlantic
- the June sea level pressure over the eastern tropical Pacific (see Figure 4 below).
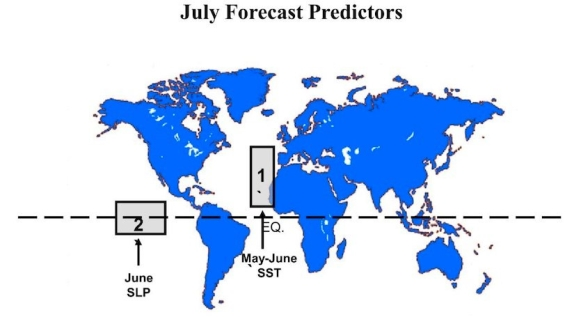
Together, these two easily assessed ingredients explain about 60% of the season-to-season variation in Atlantic ACE from July onward. What does this last sentence mean?
The main reason for this year’s mediocre July outlook was the cooler-than-average May-June SSTs over the eastern North Atlantic (see Figure 3). Cooling in this region often goes hand in hand with relatively cool waters in what’s called the Main Development Region (MDR) of the tropical Atlantic, and in turn with slower-than-average hurricane seasons. Hurricanes can only form when sea surface temperatures are above 80?F. This year, the waters of the MDR were the coolest for mid-June since at least the mid-1980s. The cooling happened quickly over the last several months and was caused by a high-pressure region intensifying over the Atlantic subtropics and in turn, strengthening the trade winds which greatly enhanced upwelling of cooler water in this region.
In contrast, there was little influence on the July outlook from sea level pressures in the eastern tropical Pacific. With neither El Niño nor La Niña in place, these were running near average. However, an El Niño Watch is now in effect, and the odds appear to be rising for at least weak or borderline El Niño conditions by August, which could put a further brake on tropical activity in the Atlantic.
Overall, the CSU outlook is for a hurricane season much more like those in the relatively calm period from the 1970s to the early 1990s as opposed to the more active period that’s prevailed from 1995 onward. However, one should never let your guard down. This is a good time to remember that 1992 was a largely quiet year, apart from Andrew, which rapidly moved into the Miami area as a fast-developing Category 5 hurricane and caused massive destruction. Andrew didn’t strengthen in a big way until it moved out of the deep tropics and approached the Bahamas. Right now, Atlantic SSTs are running above average north of about 25°N, and more than 1°C (1.8°F) above average over the northern Gulf of Mexico and large parts of the North Atlantic between about 30°N and 35°N.
Weekly Outlook:
Here is what to expect regarding precipitation and temperature in the coming week.
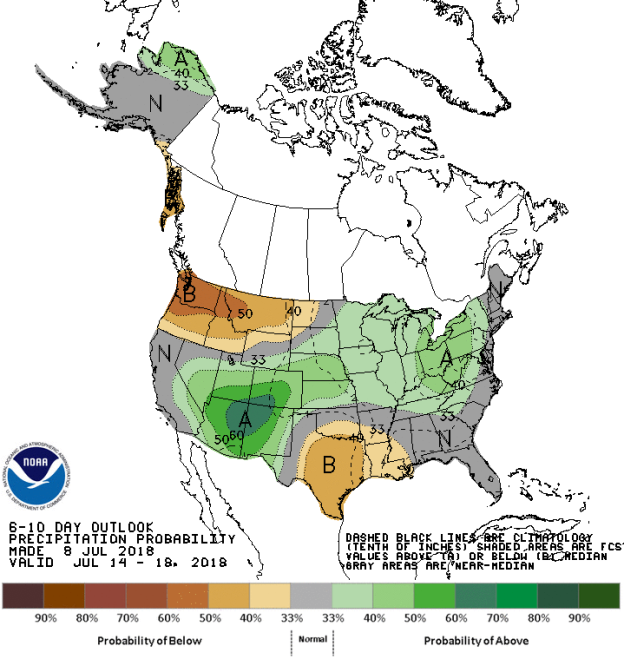
Figures 5 and 6 below show the expected 6-10-day temperature and precipitation outlooks. The colored shading on the map indicates the degree of confidence the forecaster has in the category indicated, where "B" and blue colors indicate "below-normal" and "A" and orange-red colors indicate "above normal". The darker the shading, the greater is the level of confidence. The numbers labeling the contours separating different shades gives the probability that the indicated category (A, B, or N) will occur.
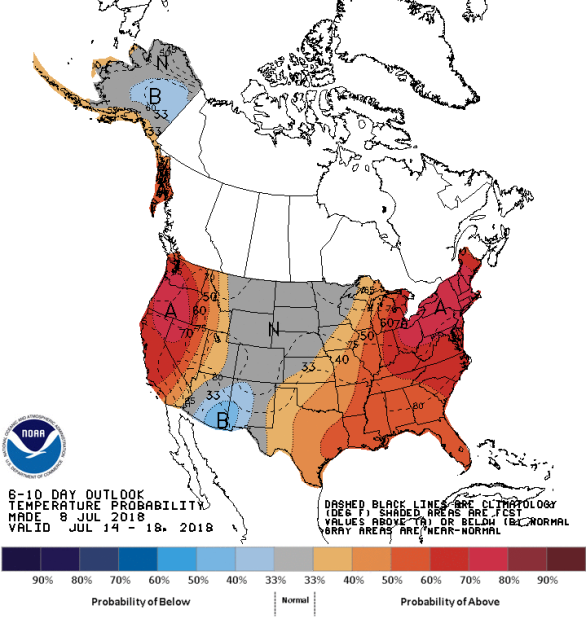
Generally, the probability of below average temperatures (as seen in Figure 5) is low over a small area of southeast Arizona and southwest New Mexico and the central eastern interior of Alaska. In general, the probability is moderate to high that the entire eastern half of the country will experience above average temperatures, centered on the Ohio Valley, the Mid-Atlantic and the entire New England area stretching southwards to Florida and westwards to the central Plain states and most of Texas. The entire West Coast, Nevada, Utah, and Idaho also should expect low to moderate probabilities of above average temperatures. Most of the Northern Tier states and the Rocky Mountain States should experience normal temperature for this time of the year.
The precipitation outlook for the next 6-10 days (Figure 6) shows the probabilities are low to moderate for below average rainfall over much eastern Texas, southern Oklahoma, southwestern Arkansas and Louisiana. Probabilities for below average are moderate to high over the Pacific Northwest, Idaho. Moderate probabilities for above average rainfall exists over far northern Alaska, the Ohio Valley, the Midwest, Kansas, southern South Dakota and Nebraska. Much of the Four Corners areas should also see moderate to high probabilities for above average rainfall. Most of California, the Deep South and Eastern Atlantic seaboard should experience average rainfall for this time of the year.
Weekly hazards output by the NWS’s Climate prediction center for the next 3-7 days is shown in Figure 7 below.
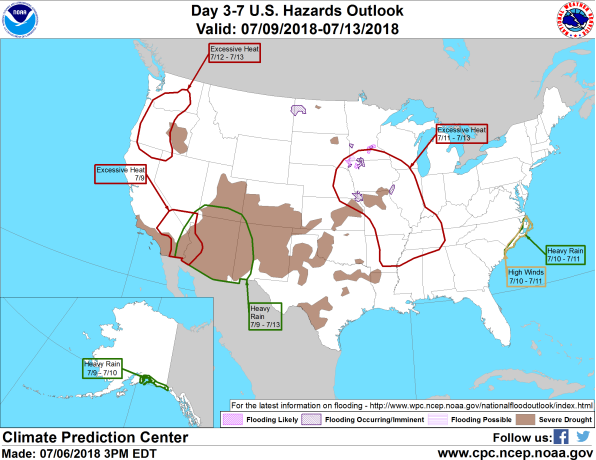
Figure 7 shows that most of the expected weather hazards over the United States in the next 3 to 7 days. The seasonal monsoon has returned to the Desert Southwest with heavy rains expected over Arizona, far southern Utah, far western New Mexico between the 9th and 13th July. Heavy rain should also be expected over southern Alaska between the 9th and 10th July. High winds and heavy rains are also expected over the North Carolina coast between the 10th and 11th July. Excessive heat can be expected over many parts of the country: on the 9th July over southern California, far southern Utah and far western Arizona; between the 12th and 13th July over much of western Oregon and southern Washington; between the 12th and 13th July over much of the northern Mississippi River Valley, including Iowa, Missouri, Illinois, northern Arkansas, western Kentucky and Tennessee.