
Climate Disasters 2018
Meteorologist Dr. Kevin Levey puts the 2018 climate disaster the microscope
Wednesday, 25 July 2018 06:52:00 -05:00
Assessing the U.S. Climate Disasters Year-to-Date (January – June) 2018
Last week we looked at the June 2018 US climate assessment and today we will looking at the year-to-date (January-June) period. Figure 1 below shows that there were six billion-Dollar weather and climate disasters during this period alone:
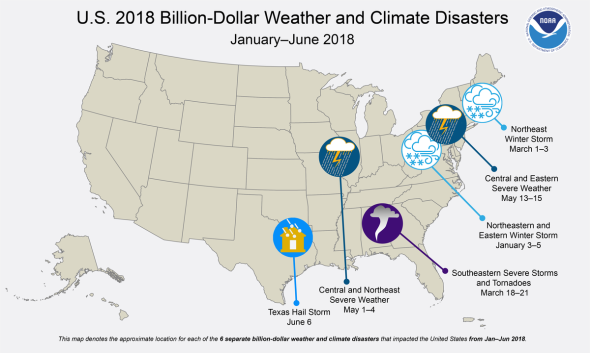
- Through the end of June, there have been six weather and climate disaster events with losses exceeding $1 billion each across the U.S. during 2018. This was double the long-term average of three events for the January-June period since 1980, but slightly less than the 7.4 event average for the January-June period of the last five years. These events included four severe storm events and two winter storm events. Overall, these events resulted in the deaths of 36 people and had significant economic effects on the areas impacted.
- Since these records began in 1980, the U.S. has sustained 233 weather and climate disasters where overall damages/costs reached or exceeded $1 billion (including CPI adjustment to 2018). The total cost of these 233 events exceeds $1.5 trillion.
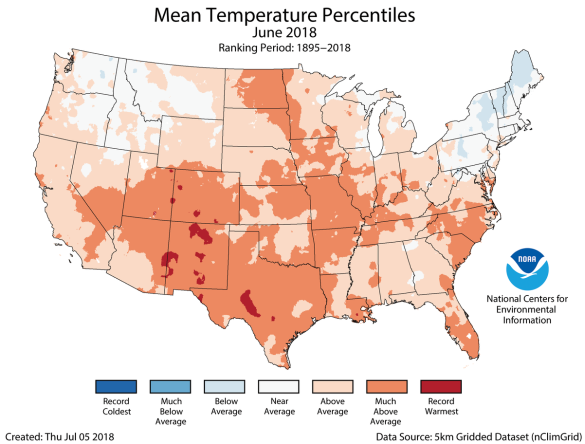
Figure 2 above shows:
- Above-average January-June temperatures were observed across the West, Southern Plains, East Coast and much of the Midwest. Eight states in the West and South had much-above-average year-to-date temperatures, including Arizona and New Mexico that were record warm. The Arizona statewide average temperature was 59.5°F, 4.3°F above average, and the New Mexico temperature was 53.4°F, 4.1°F above average. Near- to below-average temperatures were observed in the north-central contiguous U.S.
- The Alaska statewide average temperature for the year-to-date was 25.6°F, 4.3°F above average, and tied 2005 as the 10th warmest on record. Above-average temperatures were observed across western and northern areas of the state, with near-average temperatures in southern Alaska.
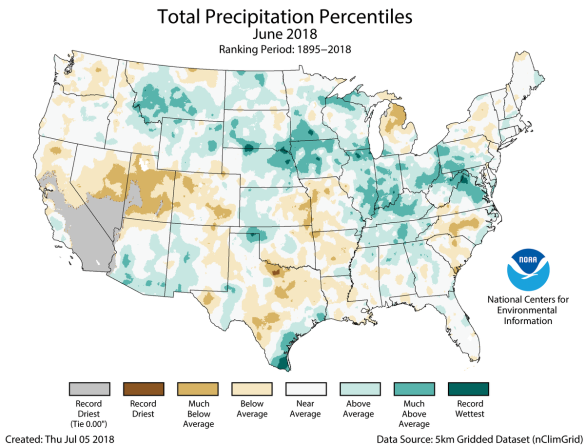
Figure 3 above shows:
- Above-average precipitation was observed in the Northern Plains, Midwest and along parts of the East Coast. Seven states had a January-June precipitation total that was much above average, with record precipitation observed for some localized areas.
- Below-average precipitation was observed for locations across the Southwest, Southern Plains, Upper Midwest and Mid-Mississippi Valley. Colorado had its 11th driest year-to-date on record.
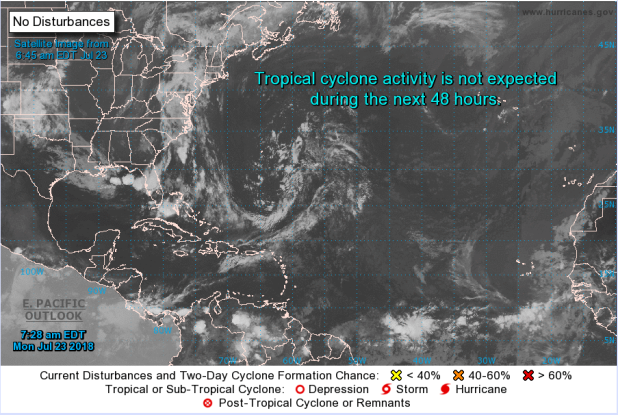
Tropical Outlook:
As we approach the historically peak weeks of hurricane season, tropical activity in the Gulf of Mexico and the Atlantic Ocean as a whole remains uncharacteristically quiet (as seen in Figure 4), with no systems currently active or threatening to develop throughout the basin. A cluster of thunderstorms that is non-tropical in nature is present just off the eastern portion of the Gulf Coast this morning and is expected to bring heavy rainfall to the central coastline during the latter half of the day today.
Despite it being the start of the traditionally peak period of the Atlantic hurricane season, no tropical systems are forecast to develop in or enter the Gulf of Mexico over the course of the upcoming week. In fact, it appears unlikely that any tropical cyclones will develop throughout the entirety of the Atlantic Ocean over the next seven days, which is highly unusual for this time of the year.
Weekly Outlook:
Here is what to expect regarding precipitation and temperature in the coming week.
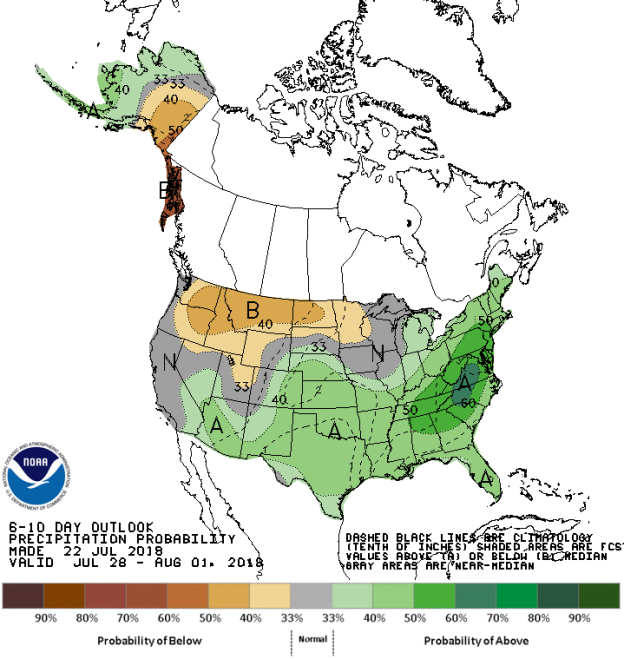
Figures 5 and 6 below show the expected 6-10-day temperature and precipitation outlooks. The colored shading on the map indicates the degree of confidence the forecaster has in the category indicated, where "B" and blue colors indicate "below-normal" and "A" and orange-red colors indicate "above normal". The darker the shading, the greater is the level of confidence. The numbers labeling the contours separating different shades gives the probability that the indicated category (A, B, or N) will occur.
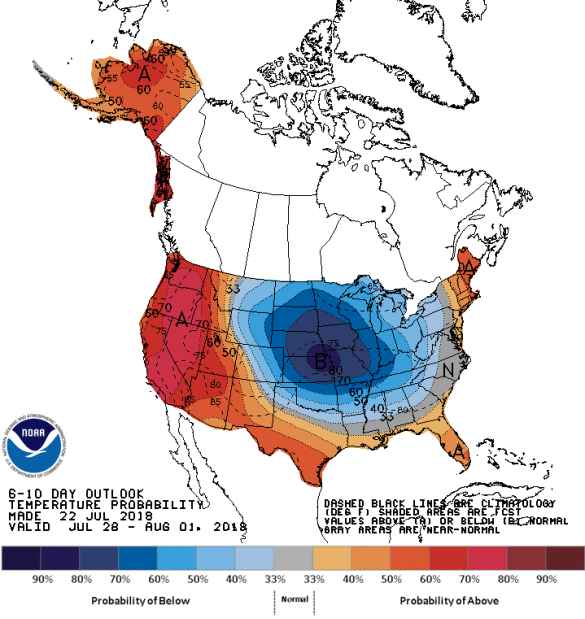
Generally, the probability of below average temperatures (as seen in Figure 5) is rather high over much of the northern-central parts of the country, centered on northeast Kansas, including the Northern Tier states east into the Midwest and the Ohio Valley and as far south as northern areas of Louisiana, Texas, Alabama, Mississippi and Georgia. In general the probability is moderate to high that the entire western third of the country will experience above average temperatures, centered on the Sierras and Cascades, including areas as far east as far western Colorado, New Mexico and southwestern Texas. Alaska, Florida and New England should expect low to moderate probabilities of above average temperatures. Few areas in the US will experience normal temperatures for this time of the year.
The precipitation outlook for the next 6-10 days (Figure 6) shows the probabilities are low to moderate for below average rainfall over much eastern areas of the Pacific Northwest, Idaho and the northern Tier states east into northern Minnesota. Probabilities for below average are moderate to high over the southeastern areas of Alaska. Moderate probabilities for above average rainfall exists over much of the rest of the United States from Arizona in the southwest eastwards to the Atlantic Ocean and north into the New England with the highest probabilities centered on the Mid-Atlantic States (Virginia). Most of California, the costa areas of the Pacific Norwest and the western areas of the Midwest should experience average rainfall for this time of the year.
Weekly hazards output by the NWS’s Climate prediction center for the next 3-7 days is shown in Figure 7 below.
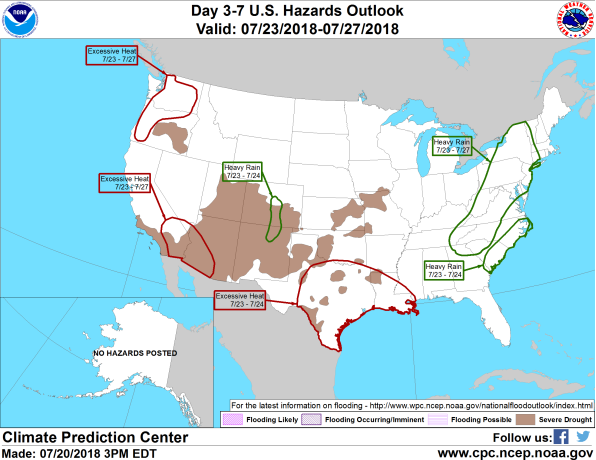
Figure 8 shows that most of the expected weather hazards over the United States in the next 3 to 7 days. Heavy rain should be expected over a small part of northern New Mexico northward into southern Colorado along the Front Range between the 23rd and 24th July. Heavy rains are expected between the 23rd and 27th in a large areas stretching from eastern Tennessee and western North Carolina in the south northwards into New England, excluding the far northern areas of New England. Heavy rain should also be expected between the 23rd and 24th July along the coastal areas of the Carolinas. Excessive heat will occur over three main areas of the county: between the 23rd and 27th July over southeastern California and far southwestern Arizona; between the 23rd and 24th July over much of eastern Texas and Louisiana and between the 23rd and 27th July over much western areas of Oregon and much of Washington except the coastal areas.
