
The State of Hurricane Forecasting in the US
Meteorologist Dr. Kevin Levey examines the state of hurricane forecasting in the US
Tuesday, 25 September 2018 05:45:00 -05:00
Tropical Outlook:
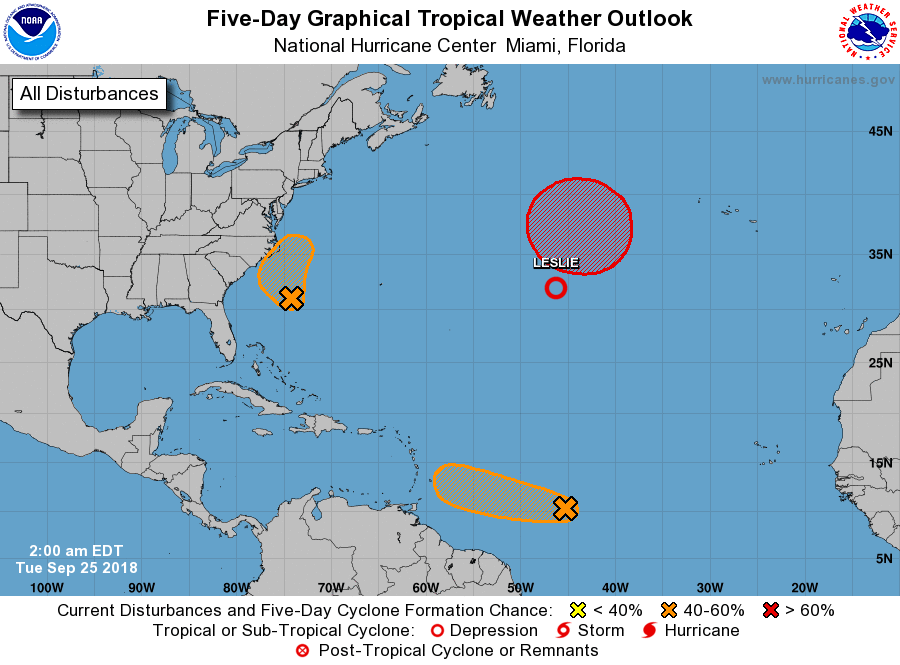
Tropical activity along the Gulf Coast and East Coast has been quiet over the past week, with no systems entering the Gulf of Mexico throughout the last seven days. The Atlantic as a whole has remained busy however, with three tropical systems currently active in the basin (See Figure 1 below). The most notable area of interest is a tropical disturbance currently located approximately halfway between Bermuda and the U.S. East Coast, as seen in Image 1. This system, designated as 98L by the National Hurricane Center, is forecast to drift towards the U.S. coastline over the next two days, with its closest approach to the Carolinas likely to occur late Tuesday or early Wednesday. The good news for this hard-hit region is that 98L will only be encountering marginally-favorable conditions for tropical cyclone development as it approaches the coastline over the next day-and-a-half. There is currently a 40%-60% chance that this system ultimately develops into a tropical depression, with only a low (<10%) chance that tropical storm-force winds impact any area along the U.S. East Coast during this system's lifespan. Still, this disturbance bears watching closely as North and South Carolina continue their recovery efforts from Hurricane Florence
State of Hurricane Forecasting in the United States.
The National Hurricane Center (NHC) is tasked with the responsibility of issuing advisories, watches and warnings for tropical cyclones, which include tropical depressions, tropical storms and hurricanes for the Atlantic and East Pacific Ocean hurricane basins. The first recorded forecast by the NHC was made back in 1954 when only 24-hour predictions of storm tracks were made. Huge strides have gone into upgrading these forecasts which now include expanding forecasts out in time, and added predictions of storm intensity, size, and associated hazards, such as wind, storm surge, and rainfall. So, just how much better are these forecasts?
Tropical storms have two components that need forecasting, viz. track (where will it go) and intensity (how strong will it be).
Track Forecasts:
Of the two forecast components, the track forecast is really important especially if it involves a potential landfall of a hurricane. In general, the NHX has greater confidence in predicting track forecasts than intensity since the track of tropical systems are generally governed by forces larger than the tropical system itself, since the surrounding steering currents cover a much larger area than the tropical storm. Global weather models do a fairly good job in predicting how these steering features might evolve over the course of a few days.
Figure 2 below shows the average NHC track forecast errors for tropical storms and hurricanes by decade commencing in the 1960s. As can be seen in Figure 2, there has been a steady reduction in the track errors over time, with the average errors in the current decade about 30-40% smaller than they were in the 2000s and about half of the size (or even smaller) than they were in the 1990s.
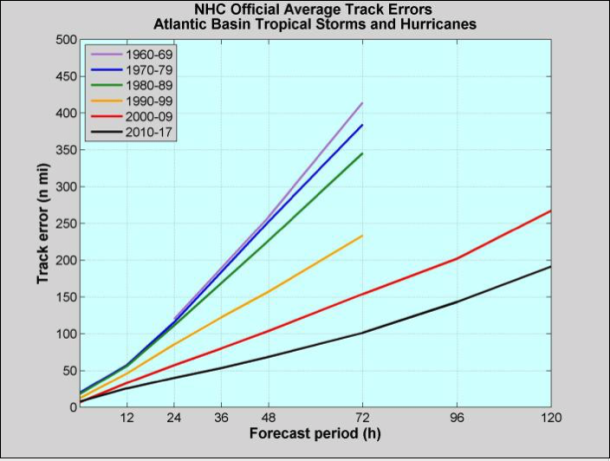
Figure 3 below highlights this great increase in forecast track accuracy. It shows two circles centered on a point near Pensacola, Florida, with the blue one representing the average 48-hour track error in 1990 and the red one showing the average 48-hour error today. What it shows is that if NHC had made a forecast for a storm to be over Pensacola in 48 hours back in 1990, the TC would have ended up, on average, not exactly over Pensacola but somewhere on the blue circle. If NHC made the same forecast today, the storm would end up, on average, somewhere on or within the red circle.
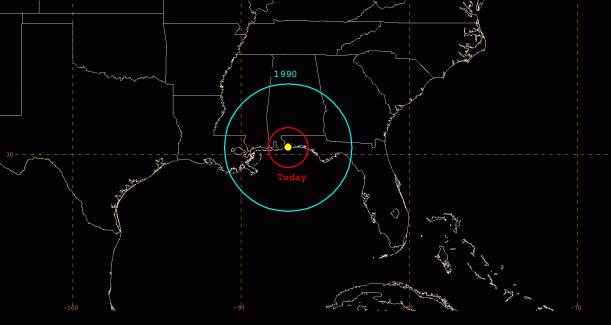
You can easily see that the NHC forecasts for the path of a TC today are much more accurate, on average, than they were decades ago, and these more accurate forecasts have helped narrow the warning areas, save lives, and make for more efficient and less costly evacuations. As mentioned in last week’s blog, the 120-hour track forecast for Hurricane Florence 120hrs (5days) out was only *two* miles north of actual landfall. Essentially it arrived on the yellow dot in Figure 3!
Intensity Forecasts:
Forecasting the intensity of a tropical storm or hurricane is generally more challenging than forecasting its track. The reason for this is that the intensity of these weather systems is affected by both large and small scale forces. On the large scale, vertical wind shear (the change of wind speed and direction with height) and the amount of moisture in the atmosphere greatly affect the amount of organization of the thunderstorm activity that the tropical storm or hurricane can produce. Ocean temperatures also affect the system’s intensity, with temperatures below 80° F usually being too cool to sustain significant thunderstorm activity. However, smaller-scale features can also be at play. One of the more complex phenomena that affects a TC’s intensity is an eyewall replacement cycle. Initially, when two eyewalls, one inside the other, are present, the hurricane’s wind field will begin to expand, and as the inner eyewall dies, the hurricane’s peak winds start to weaken.
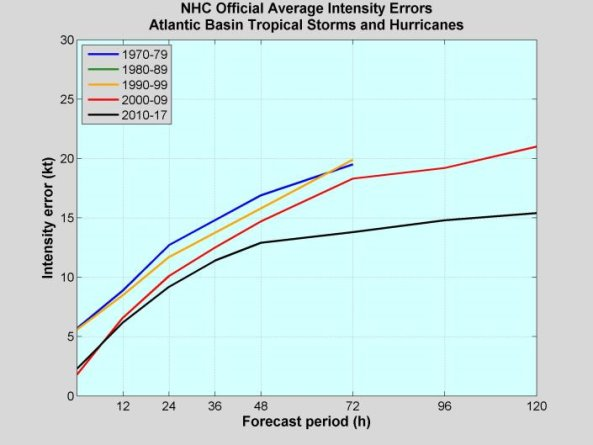
Given these complex factors and the fact that errors in the track can also affect the tropical system’s future intensity, the NHC has not made as much progress in this area as they have for track forecasting. Figure 4 (below) shows NHC average intensity errors for Atlantic tropical storms and hurricanes by decade starting in the 1970s. Note that only small improvements were made in the intensity predictions from the 1970s through the 2000s. A much more significant reduction in error has occurred in the current decade, which is an indication that recent investments in new computer hardware and more specially hurricane forecast models and techniques is beginning to pay off. Today’s intensity errors are close to 15 knots (17 mph) from 72 to 120 hours. This number is on the order of one Saffir-Simpson category, so the NHC often encourages those who could be affected by a hurricane to prepare for a storm one category stronger (on the Saffir-Simpson Hurricane Wind Scale) than what they are forecasting.
Some of the main reasons of better track and intensity forecasts of tropical systems come from the advancements in technology, specifically the improvements in the observing platforms (satellites, for example) and the various modeling systems we use to make forecasts. The amount and quality of data available to the models so they can paint an initial picture of the atmosphere have increased dramatically in the last 20 to 30 years. Also, the resolution and physics in the models we use today are far superior to what forecasters had available in the 1990s or prior decades, in part due to the tremendous improvements in computational capabilities. In addition, NHC has found ways to even beat the individual dynamical models by using a balance of statistical approaches and experience.
Weekly Outlook:
Here is what to expect regarding precipitation and temperature in the coming week.
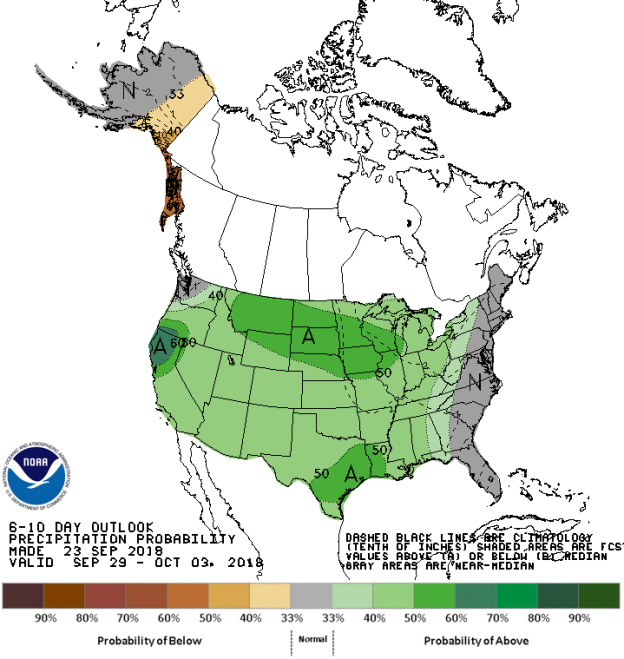
Figures 5 and 6 below show the expected 6-10-day temperature and precipitation outlooks. The colored shading on the map indicates the degree of confidence the forecaster has in the category indicated, where "B" and blue colors indicate "below-normal" and "A" and orange-red colors indicate "above normal". The darker the shading, the greater is the level of confidence. The numbers labeling the contours separating different shades gives the probability that the indicated category (A, B, or N) will occur.
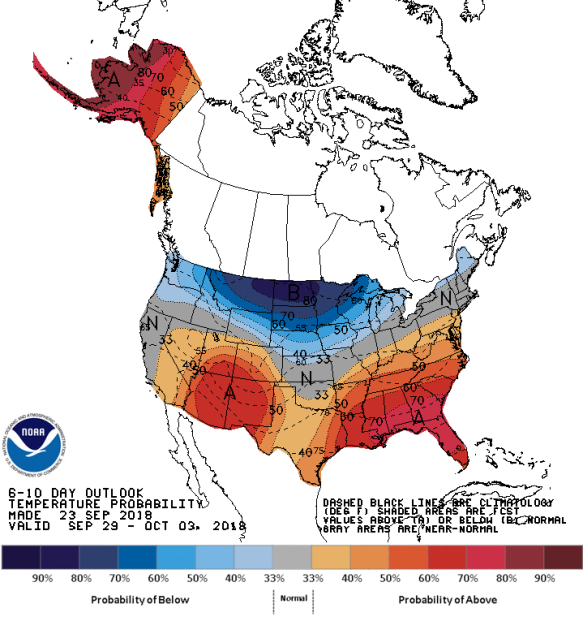
Generally, the probability of below average temperatures (as seen in Figure 5) is moderate to high over much Northern tier states California, the Pacific Northwest and the northern areas of the Midwest. In general the probability is moderate to high that the rest of the of the country will experience above average temperatures centered on the Deep South States and Florida, as well as over Arizona and New Mexico. Most of Central and Northern California, southern Oregon, Nebraska the central Ohio Valley and much of New England will experience normal temperatures for this time of the year.
The precipitation outlook for the next 6-10 days (Figure 6) shows the probabilities are low to moderate for below average rainfall over far eastern Alaska and southern Alaska. Low to moderate probabilities for above average rainfall exists over the entire country except for the entire eastern coastal areas from Florida to New England. High probabilities for above average rainfall is possible over northern California, with moderate chances over southern Texas and the Northern Tier states and western areas of the Midwest.
Weekly hazards output by the NWS’s Climate prediction center for the next 3-7 days is shown in Figure 7 below.
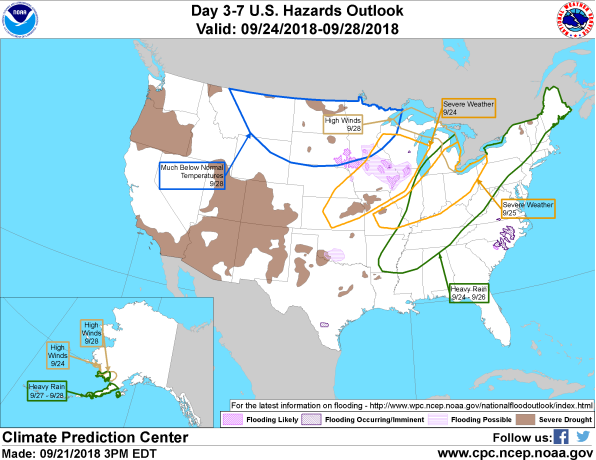
Figure 7 shows that most of the expected weather hazards over the United States in the next 3 to 7 days. Heavy rain should be expected over much of the central Mississippi River Valley, the Ohio Valley eastern Midwest, stretching into northern New England between the 24th and 26th September. Heavy rain is also expected over much of the southwestern areas of Alaska between the 27th and 28th September. High winds are also expected along the western Alaskan coastline on the 24th and 28th September. Severe weather should be expected on the 24th September over the northern Central Plains and over the western Midwestern states shifting eastwards into the Ohio Valley and eastern Midwestern states on the 25th September. The U.P. of Michigan should expect high winds on the 28th September. Much below average temperatures may be expected over the Northern Tier states including most of Montana, the Dakotas and Minnesota on the 28th September.