
Assessing the U.S. Climate - Fall 2018 and year-to-date
Meteorologist Dr. Kevin Levey takes a look at the Fall 2018 climate
Tuesday, 18 December 2018 05:00:00 -06:00
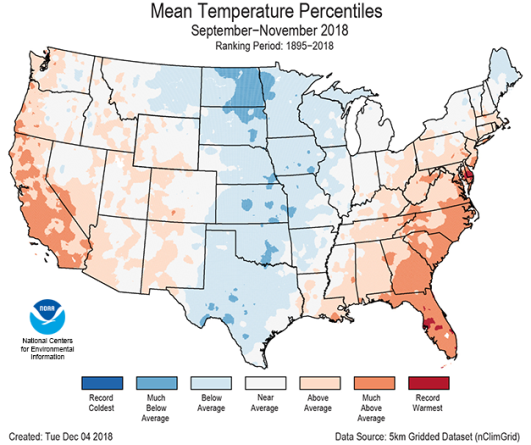
During meteorological autumn (September–November), the average temperature was 53.8°F, 0.2°F above average, ranking near the middle value in the 124-year period of record. Figure 1 (below) shows the mean temperature percentiles for Autumn 2018 and what is clearly obvious from that figure are the following:
- Above-average autumn temperatures spanned both coasts with below-average conditions across the interior. Most of the warmth in the East occurred early in the season, with the West consistently warmer than average. Seven states had a seasonal temperature that ranked among the 10 warmest, while North Dakota had its 12th coolest autumn.
- Maximum temperatures were particularly cool across the Great Plains, Midwest, and Northeast. Seven states had a top 10 cold autumn maximum temperature. Minimum temperatures were above average in the West, South, and East. Delaware, Maryland, and West Virginia each had record warm autumn minimum temperatures with 15 additional states having top 10 warm conditions.
- The Alaska autumn temperature was 32.4°F, 6.5°F above the long-term average. This marked the second warmest autumn on record for Alaska, behind 32.9°F that occurred in 2002. Record warmth was observed across western and southern parts of the state. Many towns, including Anchorage, Bethel, Nome and Cold Bay, had their warmest autumn on record. The above-average temperatures limited snowfall with only 5.3 inches accumulating in Denali National Park, the lowest autumn total since 1943.
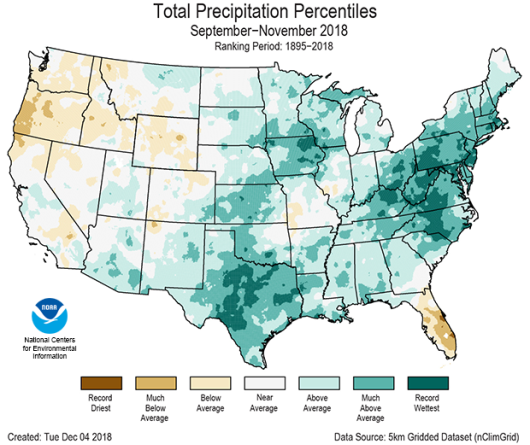
The autumn precipitation total for the contiguous U.S. was 9.61”, 2.73” above average. This was the second wettest autumn on record, behind the 9.72” that fell in 1985. (see Figure 2 below).
- Above-average precipitation fell across many locations east of the Rockies. Maryland, New Jersey, North Carolina, Rhode Island, Texas, Virginia, and West Virginia each had their wettest autumn on record. Fifteen additional states had a top 10 wet autumn. Drier-than-average conditions were observed in the Northwest and in Florida. Locations along Florida’s Atlantic Coast were record dry, including West Palm Beach.
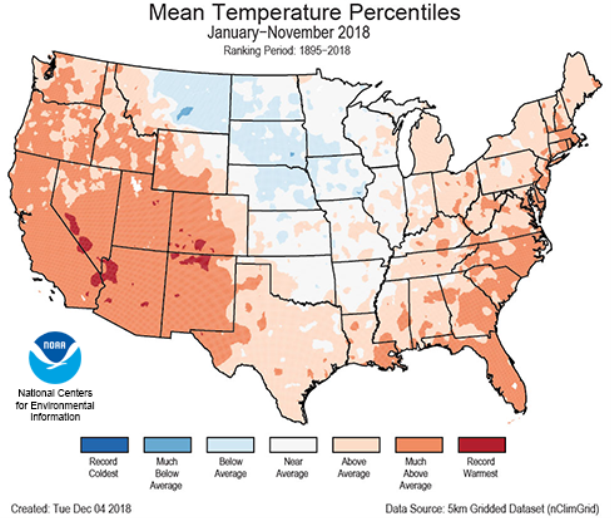
For the year-to-date, the contiguous U.S. temperature was 55.2°F, 1.4°F above the 20th century average and was the 16th warmest January–November on record. This was the coolest January–November since 2014 (see Figure 3 below).
- Above-average temperatures were observed across the West and East where 13 states had a top 10 warm January–November. Alaska had its third warmest year-to-date on record. Near- and below-average temperatures were observed across the Central and Northern Plains to the Upper Midwest. No state had a record warm or cold year-to-date.
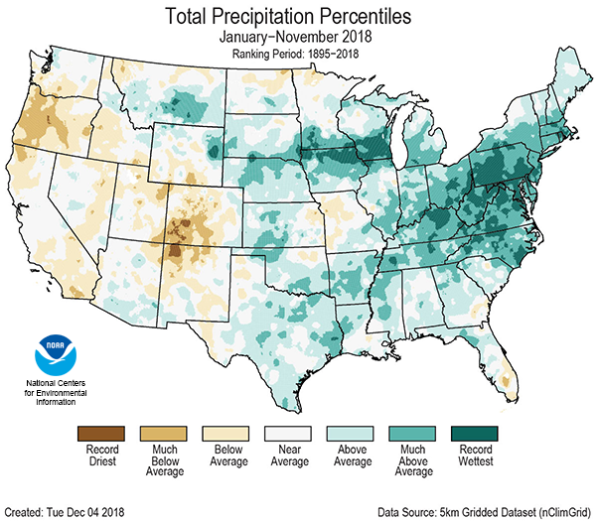
For the year-to-date, the national precipitation total was 31.31”, 3.72” above average. This marked the fifth wettest January–November on record and wettest since 1998 (see Figure 4 below).
- Above-average January–November precipitation fell across most locations east of the Rockies. Eight states from the Mid-Atlantic to Northeast were record wet with near-record precipitation totals observed into the Midwest. Below-average precipitation stretched from the Northwest to Southwest, with Oregon having its 10th driest year-to-date on record.
Weekly Outlook:
Here is what to expect regarding precipitation and temperature in the coming week.
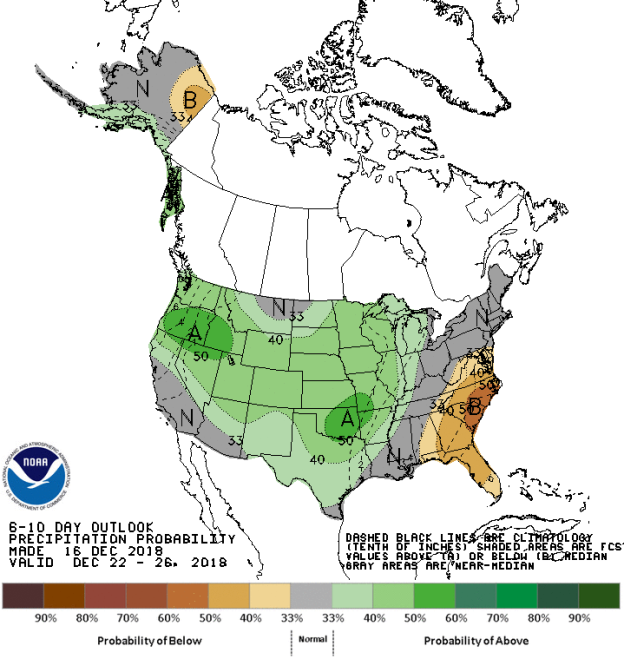
Figures 5 and 6 below show the expected 6-10-day temperature and precipitation outlooks. The colored shading on the map indicates the degree of confidence the forecaster has in the category indicated, where "B" and blue colors indicate "below-normal" and "A" and orange-red colors indicate "above normal". The darker the shading, the greater is the level of confidence. The numbers labeling the contours separating different shades gives the probability that the indicated category (A, B, or N) will occur.
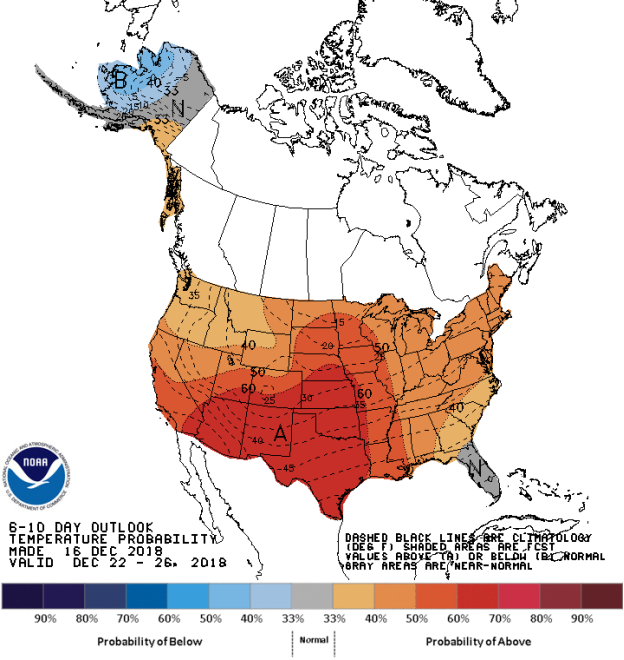
Generally, the probability of below average temperatures (as seen in Figure 5) is generally low over Alaska only. In general, the probability is low to moderate that with the exception of Florida, the entire United States will experience above average temperatures, especially over the Southern Plains states, Texas, New Mexico and Arizona. Florida will experience normal temperature for this time of the year.
The precipitation outlook for the next 6-10 days (Figure 6) shows moderate probability of below average precipitation over far northeastern Alaska, Florida and over much of the East Coast from Florida northwards into Virginia and. A low to moderate chance for above average rainfall exists for much of the central and western areas of the country west of the Mississippi. The probability is about 50% that above average rainfall will occur over Oregon and most of Idaho and also parts of eastern Oklahoma. Most of southern California, New England and the Ohio Valley should expect to receive average rainfall.
Weekly hazards output by the NWS’s Climate prediction center for the next 3-7 days is shown in Figure 7 below.
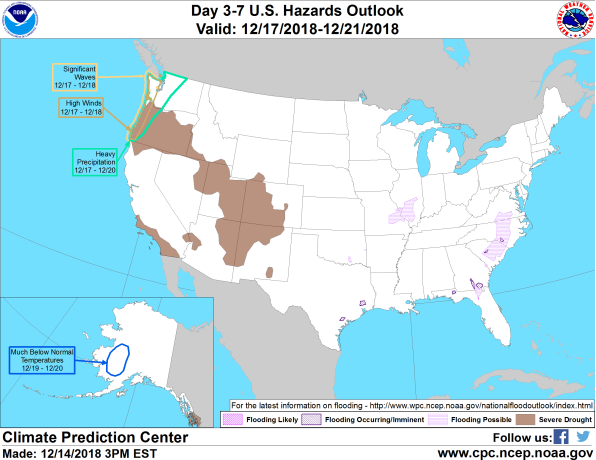
Figure 7 shows a relatively quiet period ahead in the next 3 to 7 days. Heavy precipitation is expected over the coastal areas of the Pacific Northwest between the 17th and 20th December. High winds and significant waves are also expected along the coastal areas of Oregon and Washington between the 17th and 18th December. Much below average temperatures should be expected over southwestern Alaska between the 18th and 20th. Areas of flooding are still possible over parts of the Carolinas, northern Florida/southern Georgia and parts of eastern Missouri/southwestern Illinois.