Cold and Wet in February and March?
ContactRelief meteorologist Dr. Kevin Levey tells us what to expect for temperature and precipitation trends in Febrary and March
Tuesday, 22 January 2019 14:15:00 -06:00
Two weeks ago, I mentioned the atmospheric event referred to as “Sudden stratospheric Warming” or SSW which tends to precede cold weather outbreaks over Europe and the USA. That will be discussed in the upcoming weekly outlook at the end of this blog. Will the cold spell continue into February and March – we will look at the upcoming two months precipitation and temperature forecasts.
Figure 1 below shows the expected daily precipitation anomalies forecast for February 2019 by the North American Multi-Model Ensemble (NMME). This model is a collaboration between several climate modeling centers, those being in North America and abroad. Generally, below average rainfall is expected over the entire West Coast, Nevada and Idaho. Much of the central parts of the country is expected to receive mostly average to slightly above av4rage rainfall (eastern Colorado & Kansas). Most of the eastern third of the country is also expected to receive below average rainfall, stretching from eastern Texas up into New England with the exception of much of Georgia, northern Florida and the Carolinas. Precipitation should be mostly above average over Alaska, but much above average over southeastern Alaska. Below average rainfall should be expected over Hawaii. (Figure 1).
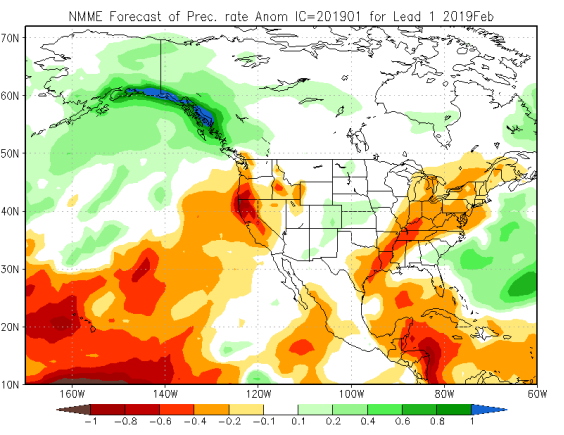
Figure 2 below shows the expected temperature departures for normal for February 2019. Most of the southern Texas and the southeastern areas of the USA stretching northwards to the Mid-Atlantic States should expect average to slightly below average temperatures. The rest of the country, including Hawaii and Alaska should expect above average temperatures, especially over the northern half of the USA with departures of 1-2°C (2-4°F).
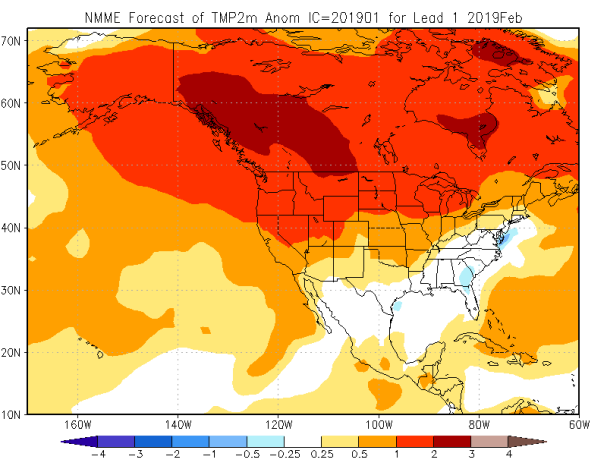
Figure 3 below shows the expected daily precipitation anomalies forecast for March 2019. Continued below average rainfall expected over California and Oregon and Hawaii. Other than West Virginia and Virginia, most of the eastern third of the USA should expect above average precipitation in March. Precipitation should be mostly above average over Alaska, but much above average over southeastern Alaska
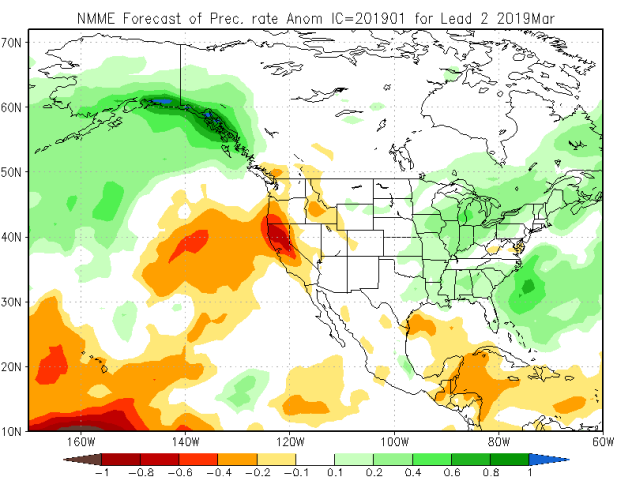
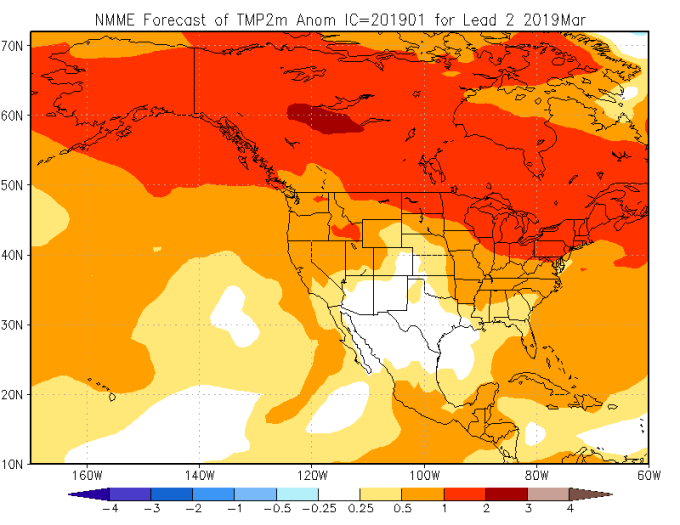
Figure 4 below shows the expected temperature departures for normal for March 2019. Much of the Desert Southwest, Texas and eastern Colorado should expect mostly average temperatures. The remainder of the country, including Hawaii and Alaska should expect above average temperatures, with the greatest positive departures (1-2°C or 2-4°F) over the far northern areas, from Montana to New England, while most departures will be between 0.5-1°C (1-2°F).
It will be interesting to verify these forecasts in April and see how accurate these forecasts are. As a CAVEAT, at best, these models have a 50/50% accuracy. However, they do give some idea/trend to what we should expect. Actual values will vary, as will the spatial coverage.
Weekly Outlook:
Here is what to expect regarding precipitation and temperature in the coming week.
Figures 5 and 6 below show the expected 6-10-day temperature and precipitation outlooks. The colored shading on the map indicates the degree of confidence the forecaster has in the category indicated, where "B" and blue colors indicate "below-normal" and "A" and orange-red colors indicate "above normal". The darker the shading, the greater is the level of confidence. The numbers labeling the contours separating different shades gives the probability that the indicated category (A, B, or N) will occur.
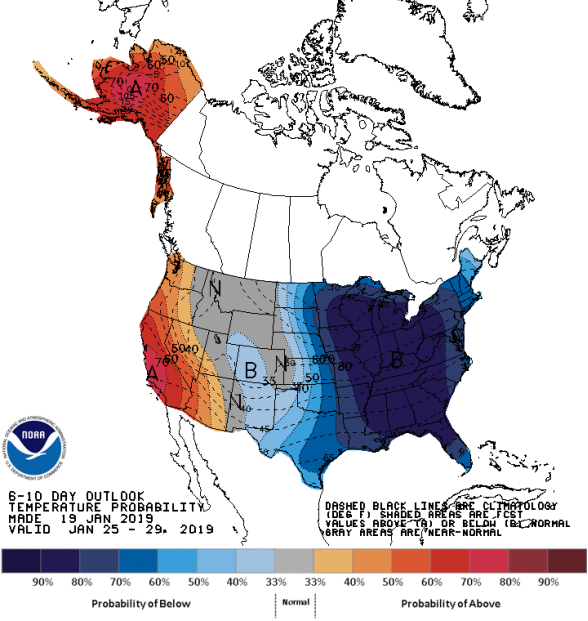
Generally, the probability of below average temperatures (as seen in Figure 5) is very high (almost certain possibility) over the entire eastern half of the USA as very cold polar air plunges southwards as a result of a deep trough over these areas. Confidence is very high for much above average temperatures for this time of the year over the West Coast states including Alaska, Arizona, California, the Pacific Northwest and Nevada as this area will be under the influence of a strong ridge. Montana, Idaho, Wyoming and much of Utah and eastern Colorado ill enjoy normal temperatures for this time of the year.
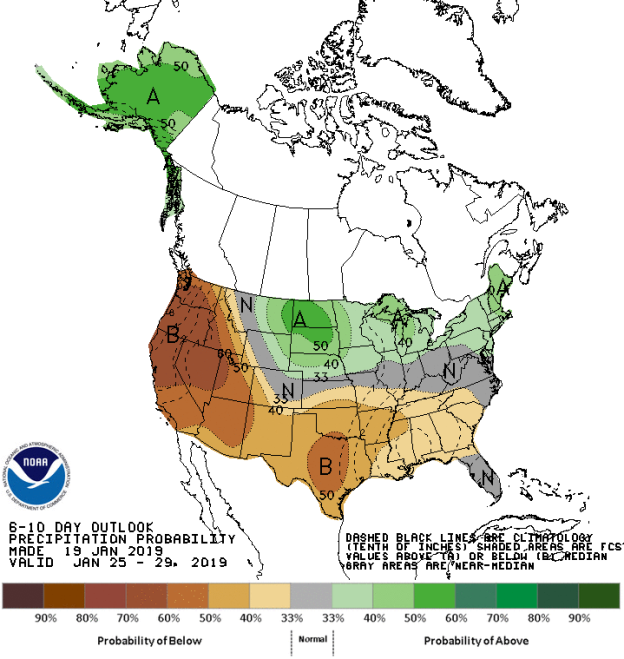
The precipitation outlook for the next 6-10 days (Figure 6) shows moderate confidence of below average precipitation over much of western and southern areas of the country, including the Pacific Northwest, California eastwards to South Carolina. The Pacific Northwest and northern California have the highest probabilities of experiencing below average precipitation. A moderate chance for above average rainfall exists for much of the northern and New England States. Confidence is high for above average rainfall over all of Alaska. The Mid-Atlantic states and most of Florida should experience mostly average precipitation for this time of the year.
Weekly hazards output by the NWS’s Climate prediction center for the next 3-7 days is shown in Figure 7 below.
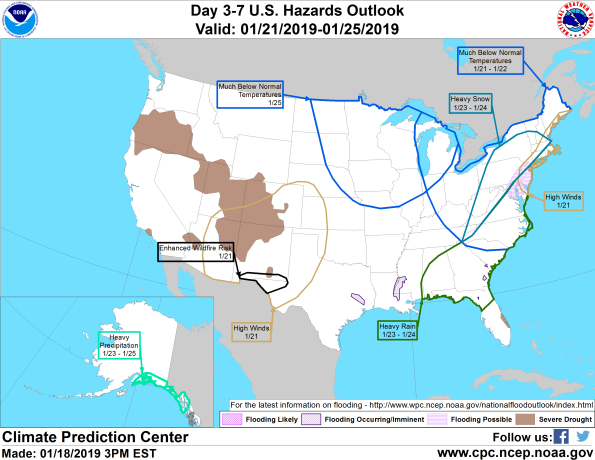
Figure 7 shows that most of the expected weather hazards over the United States in the next 3 to 7 days. The most important hazards will be the cold. Much below normal temperatures are expected over much of the northeastern areas of the country including the Ohio Valley, New England and the Mid-Atlantic States between the 21st and 22nd January and on the 25th January over much of the Northern Plains and Midwest as very cold air from the Arctic moves southwards into these areas. Heavy Rain is expected over much of the southeast and Mid-Atlantic between the 23d and 24th January. Heavy snow is expected over the Appalachians from southwestern Virginia northwards into Pennsylvania and much of southern New England between the 23rd and 24th January. Heavy precipitation is expected over much of southern and southeastern Alaska between the 23rd and 25th as the Jetstream shifts northwards into Alaska and gives the west coast a reprieve from the last 2 weeks of storms. With a large ridge over the Western half of the country most of this upcoming week, Enhanced wildfire risks accompanied by high winds is expected over southern New Mexico and far western Texas on the 21st January, but the high winds should be expected over the eastern half of Arizona, New Mexico, western Texas and most of Colorado.
Get in touch
Shaping your outbound contact away from disaster stricken areas isn't just the right thing to do, it's smart business. To learn more about how ContactRelief can help you protect your brand, reduce your risk of adverse actions, and improve your contact center efficiency, click below to contact us.
Contact us