
Want to reach up to 5 times more contacts during a disaster?
Sign up for a free trial
Can there be a mild winter after the Polar Vortex cold?
Punxsutawney Phil says an early spring but what does ContactRelief Meteorologist Dr. Kevin Levey say?
Tuesday, 05 February 2019 04:20:00 -06:00
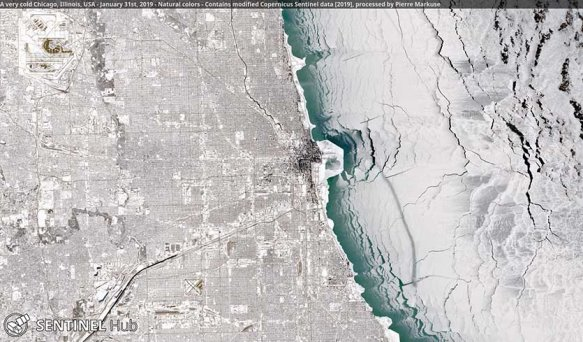
At least four cities plummeted to all-time low temperatures, and an observer in Mount Carroll, Illinois, recorded a temperature of –38°F, which if confirmed by NOAA would beat the current all-time Illinois cold record of –36°F set Jan. 5, 1999 in Congerville. Much warmer air moved into the Midwest this weekend: some parts of Iowa and Illinois were almost 80°F warmer this morning than they were last week Thursday morning! So, instead of spending a lot of time repeating what you have been hearing on TV all week about the record-setting low temperatures and absurdly low wind chills, I thought I would talk about 5 things that emerged from this past week’s frigid arctic outbreak over much of the Midwest and Northeast.
1] ”Polar Vortex” is a term that people seem to really like!
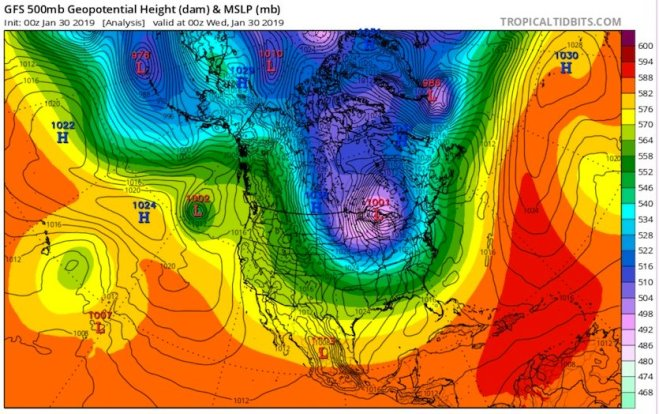
Sometimes an obscure scientific phrase jumps into the popular lexicon and spreads like wildfire. The phrase “polar vortex” has appeared in peer-reviewed journal articles since the 1950s, and it has been defined in the AMS Glossary for decades. It came into much wider use after it appeared on the Climate Central website during the cold outbreak of January 2014. This year, the phrase was inescapable—a convenient, easy-to-remember scapegoat. Brightly colored maps (See Figure 2 below) made it obvious where upper-level spin was focused over the Great Lakes, making the idea of the polar vortex even more tangible for the general public.
There are actually two polar vortices. There is a large, asymmetric polar vortex that spins in the troposphere (the lowest few miles of the atmosphere) year-round – also known as the Jetstream. A more compact polar vortex develops higher up, in the stratosphere, each fall and dissipates each spring (See Figure 3 below).
Dips in the tropospheric polar vortex commonly sweep across midlatitudes and drag cold fronts (winter storms) with them. Less often—about once every couple of years, but with huge decade-to-decade variability—the stratospheric polar vortex gets disrupted by a sudden stratospheric warming (SSW) as I mentioned in a blog a few weeks back. This kind of disruption, which can split the stratospheric polar vortex into two or three pieces, may filter downward over a period of weeks and interact with the tropospheric polar vortex. An SSW preceded the January 2014 cold outbreak by several weeks. Likewise, an SSW occurred in late December 2018, nearly a month before a lobe of the tropospheric polar vortex broke off over the Great Lakes in late January 2019.
It is important that those who use “polar vortex” should clearly distinguish between the stratospheric and tropospheric varieties. The “Use of the term without adequate explanation can suggest a more dramatic change to the global tropospheric circulation than has actually occurred (e.g., “The polar vortex is back!”) according to Waugh in the BAMS article.
2] The very cold arctic outbreak was very well predicted.
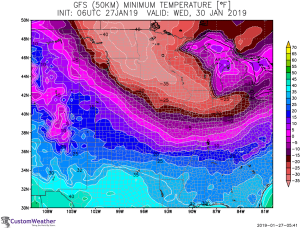
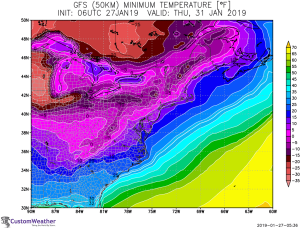
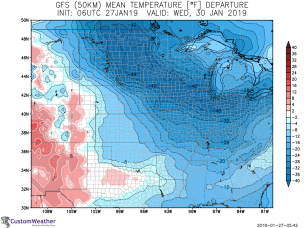
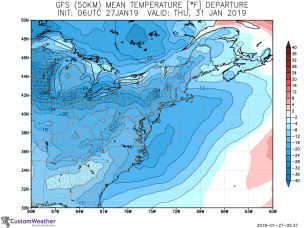
It can’t be stressed enough: forecasters saw this one coming. When the sudden stratospheric warming occurred at year’s end, it began to raise the prospect of a fracture in the stratospheric polar vortex and the possibility of intense midlatitude cold to come. Finally, weather models correctly projected a week in advance that a lobe of the tropospheric vortex would invade the Great Lakes, bringing a memorable cold outbreak into the Midwest (as shown last week and again in Figures 4a&b below)
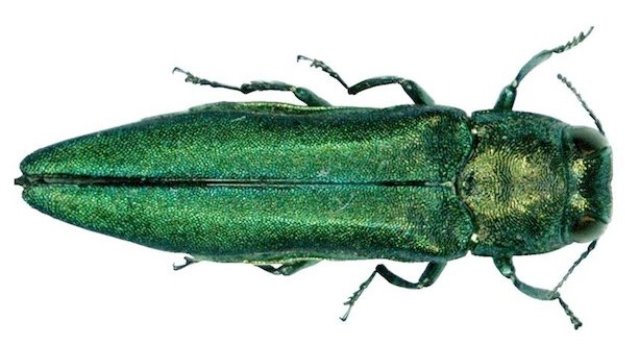
3] Reduction of the emerald ash borer.
This past week’s intense cold will have additional victims, but welcome ones—the emerald ash borer (See Figure 5 below), an invasive beetle that has killed an estimated 100 million ash trees in the United States since it was discovered in 2002 in Michigan. Cold weather kills emerald ash borer, with a mortality rate of about 5% when temperatures reach 0°F, 34% at -10°F, 79% at -20°F, and an impressive 98% at -30°F. Most of the Midwest suffers from serious infestations of the insect, and this week’s cold blast can be expected to cause a significant reduction in their numbers. I guess it’s nature’s way of controlling populations of various species.
4] Nearly all of the U.S. could still end up with a warmer-than-average winter.
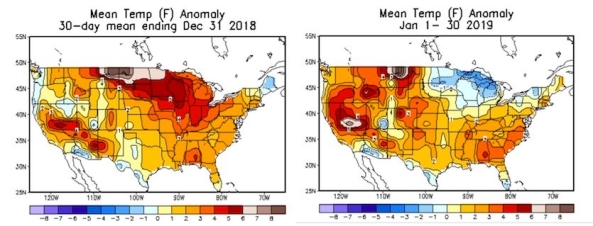
This past week I started teaching again after the winter for the Spring Semester. One of the first questions I always ask in my first class is this – what the difference between climate and weather? - and it was rather topical on Twitter this past week for reasons I won’t go into. Just as we tend to remember a few key incidents from our childhood, it’s the most extreme weather events that stick out in our minds over time. When Midwesterners think of the winter of 2018-19, many will no doubt go straight to this week’s frigid Arctic blast. Yet up through last week, the U.S. was experiencing a notably mild winter (see Figure 6 below). The extreme cold of January 31st will pull down the final January average shown in Figure 6 by as much as 1°F to 2°F in parts of the Midwest. Even so, the two months combined will end up milder than average across virtually all of the contiguous United States.
5] Arctic-mid-latitude connections – the research continues.
Much of last week’s media coverage stressed the potential role of climate change in triggering the “Arctic Midwest.” There is a very real possibility that events likely caused by human-produced climate change, such as the decline in Arctic sea ice, are leading to a weaker, more variable stratospheric polar vortex. Temperatures across large parts of northern midlatitude land areas have not warmed much at all since the 1990s, bucking the trend toward warming that’s evident at most other locations and times of year.
Some types of extremes—such as the tendency of the heaviest rain events to intensify over time—have been clearly linked to human-produced climate change, through decades of research and many years of observation. The idea that climate change may be inducing midlatitude cold outbreaks is more complex, in part because it runs counter to extensive global modeling work showing that, overall, winter cold will get less extreme over time. It's even possible that two influences related to climate change—high-altitude warming in the tropics and Arctic sea ice loss—are both having effects on the Arctic's stratospheric polar vortex, as discussed in a tweetstorm last week Thursday by Amy Butler (CIRES and NOAA/ESRL).
As research continues to mount on Arctic-midlatitude connections, there remains a spectrum of opinion among climate scientists on the extent to which extreme midlatitude winter weather in recent years may be a function of natural variability as opposed to longer-term trends. Carbon Brief has just published an excellent, accessible overview of the science around Arctic warming and midlatitude extremes, including the prospects for eventual consensus.
Weekly Outlook:
Here is what to expect regarding precipitation and temperature in the coming week.
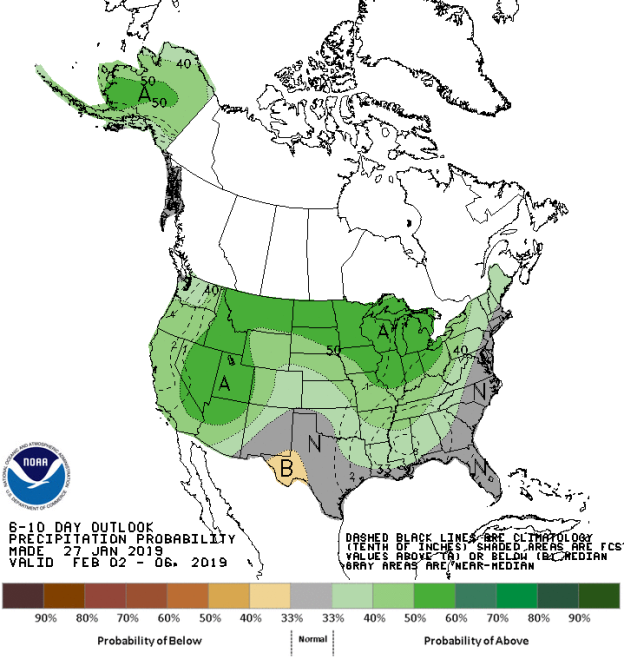
Figures 7 and 8 below show the expected 6-10-day temperature and precipitation outlooks. The colored shading on the map indicates the degree of confidence the forecaster has in the category indicated, where "B" and blue colors indicate "below-normal" and "A" and orange-red colors indicate "above normal". The darker the shading, the greater is the level of confidence. The numbers labeling the contours separating different shades gives the probability that the indicated category (A, B, or N) will occur.
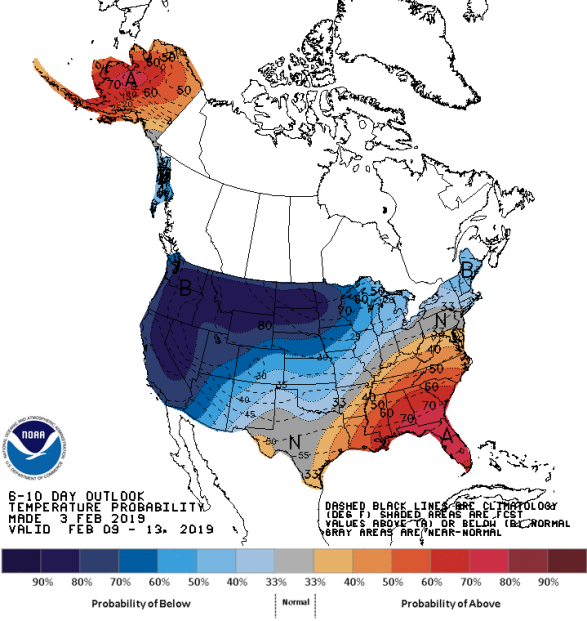
Generally, the probability of above average temperatures (as seen in Figure 7) is high over the southeastern areas of the USA centered on Florida and also over almost all of Alaska, expect the far southeastern areas. Confidence is very high for below average temperatures over the western half of the country, especially over the Pacific Northwest, the Northern Tier States and California. Much of Texas, parts of the Ohio Valley and Pennsylvania will experience mostly normal temperatures for this time of the year.
The precipitation outlook for the next 6-10 days (Figure 8) shows low confidence of below average precipitation over much of Florida. The far northwestern areas of the Washington and southeastern Alaska. Almost the entire rest of the country should experience above average precipitation with a low to moderate confidence especially the central Mississippi River Valley and much of California. Very few locations will experience average precipitation for this time of the year.
Weekly hazards output by the NWS’s Climate prediction center for the next 3-7 days is shown in Figure 9 below.
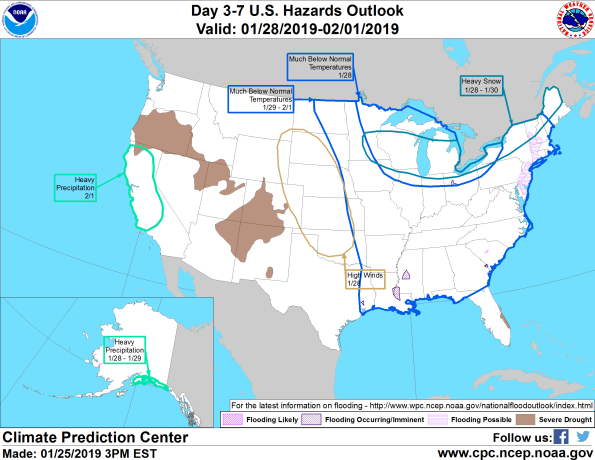
Figure 9 shows that most of the expected weather hazards over the United States in the next 3 to 7 days. Much below normal temperatures will occur over the eastern Pacific Northwest, the Northern Tier states and the Northern Plains states from eastern Washington to Minnesota and as far south as Kansas between the 4th and 8th February. Heavy rain is expected between the 6th and 8th February over much of the Central Mississippi River Valley stretching northeastwards into the Ohio Valley. Heavy snow is forecast on the 4th and 5th February over much of the Northern and Central Sierras. Heavy snow is also forecast on the 5th February over the far northeastern areas of Utah. Significant waves and high winds are expected on the 5th February over the Aleutian Islands chain of Alaska. Heavy snow is expected over much of far southern Alaska on the 5th February.