
The Winter Storm of the Century
And it wasn't 2019
Tuesday, 19 March 2019 07:20:00 -05:00
Remembering the 1993 “Storm of the Century”
Monday,18th March 2019.
It is hard to believe that it has been just a little more than a quarter of a century that the eastern half of the USA experienced the “Storm of the Century” on March 12-14th 1993! This massive storm (as seen in Figure 1 below) system bore down on nearly half of the U.S. population. It caused approximately $5.5 billion in damages ($9.8 billion in 2019 dollars) and became known as America’s “Storm of the Century”. With a central pressure usually found only in Category 3 hurricanes, the storm spawned tornadoes and left coastal flooding, crippling snow, and bone-chilling cold in its wake. Of the more than 200 weather and climate events with damages exceeding $1 billion since 1980, this storm remains the country’s most costly winter storm to date.
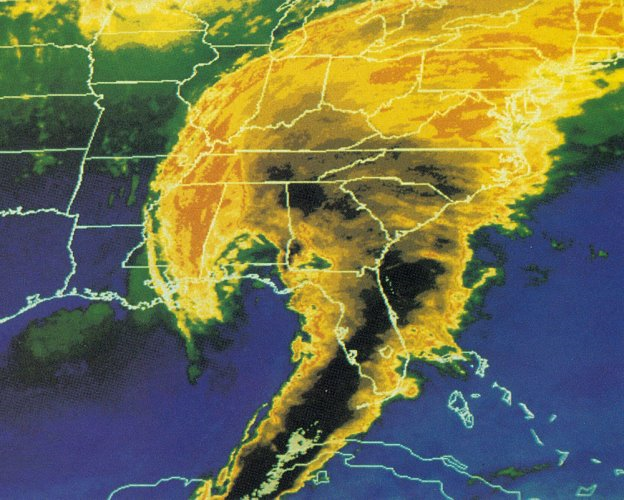
It swept from the Deep South all the way up the East Coast. Before the huge storm system developed over the East, it spun up over Texas, bringing damaging winds and hail to southeastern areas of the Lone Star state the evening of March 11. Figure 2 below shows the evolution of the storm and evolved and finally dissipated on the 14th March 1993 over New England.
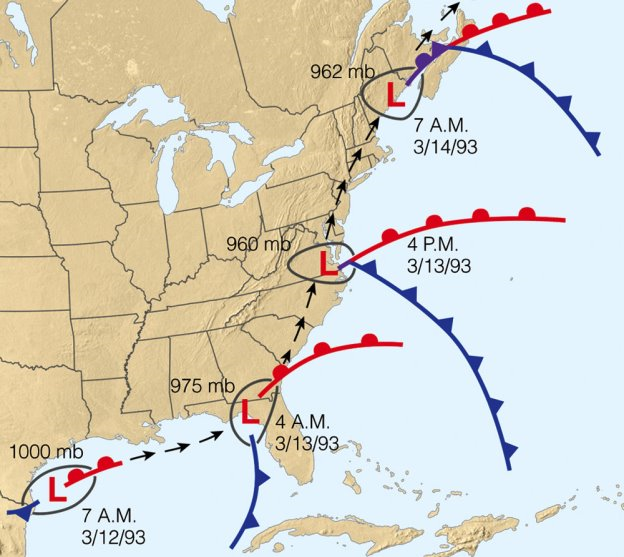
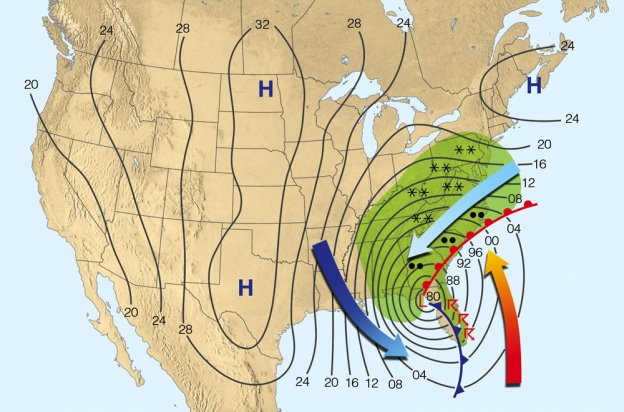
As Figure 2 shows, the storm formed off the coast of Texas on the 12th March and with strong upper-level support rapidly intensified, or what meteorologists refer to as explosive cyclogenesis on the 13th as seen in Figure 3 below.
Massive snow producer
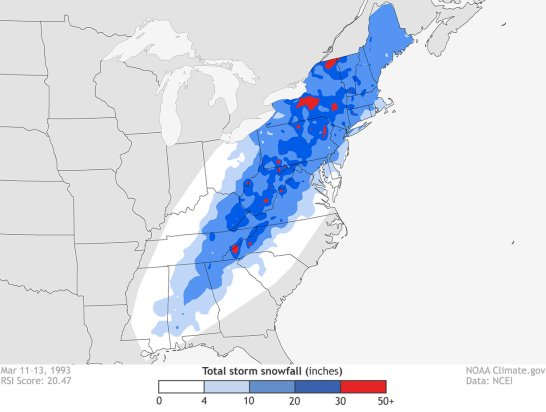
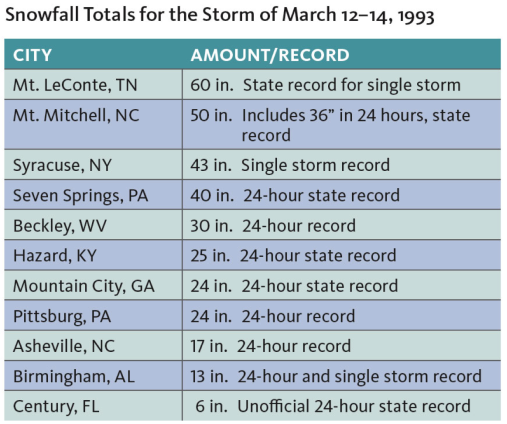
During the height of the storm, snowfall rates of 2–3 inches per hour occurred. New York’s Catskill Mountains along with most of the central and southern Appalachians received at least 2 feet of snow. Wind-driven sleet also fell on parts of the East Coast, with central New Jersey reporting 2.5 inches of sleet on top of 12 inches of snow—creating somewhat of an “ice-cream sandwich” effect. Up to 6 inches of snow even blanketed the Florida Panhandle. Figure 4 below shows the accumulated snowfall during the storm.
Overall, the storm ranked as Extreme, or a Category 5, on the Regional Snowfall Index for the Northeast, Southeast, and Ohio Valley regions. Covering more than 550,000 square miles and impacting nearly 120 million people in these three regions, the Storm of the Century still ranks as the second worst snowstorm to impact the Northeast, Southeast, and Ohio Valley.
Some particularly notable snowfall totals included:
- 56 inches at Mount LeConte, Tennessee
- 50 inches at Mount Mitchell, North Carolina, with 14-foot drifts
- 44 inches at Snowshoe, West Virginia
- 43 inches at Syracuse, New York
- 36 inches at Latrobe, Pennsylvania, with 10-foot drifts
Figure 5 below shows some of the snowfall records measured between 12-14th March 1993.
In addition to the snow, an estimated 15 tornadoes struck Florida, and 44 deaths were attributed to either the tornadoes or other severe weather in the state. A 12-foot storm surge also occurred in Taylor County, Florida, resulting in at least seven deaths.
The storm’s high winds were also extremely devastating, with at least 15 stations along the East Coast reporting wind gusts of 70 miles per hour or stronger. Dry Tortugas, west of Key West, Florida, recorded a wind gust of 109 miles per hour. And, Mount Washington, New Hampshire, recorded a gust of 144 miles per hour.
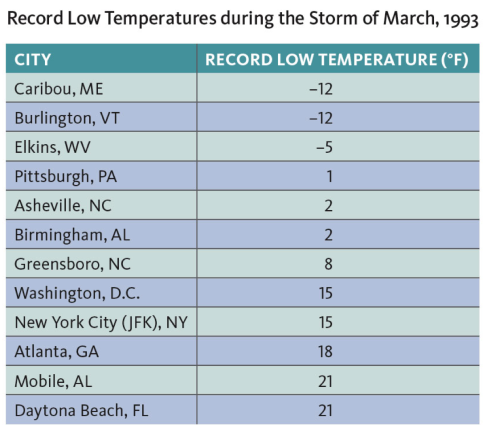
Record cold temperatures were also observed as seen in Figure 6 below.
Weekly Outlook:
Here is what to expect regarding precipitation and temperature in the coming week.
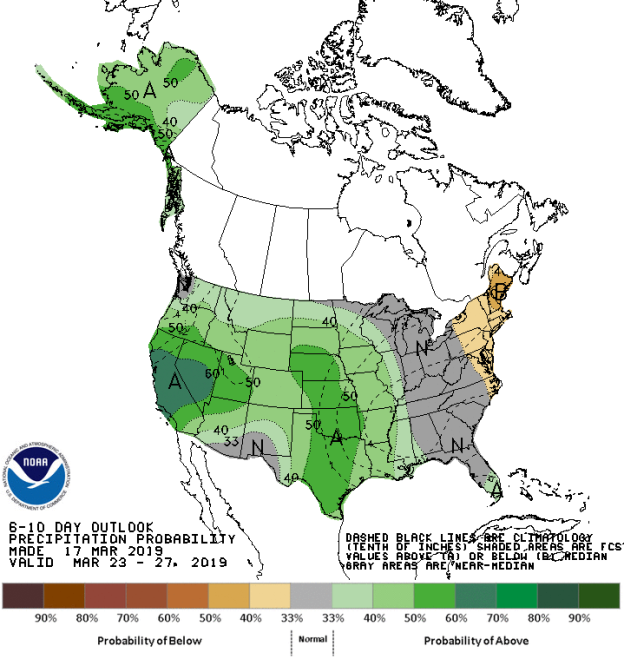
Figures 7 and 8 below show the expected 6-10-day temperature and precipitation outlooks. The colored shading on the map indicates the degree of confidence the forecaster has in the category indicated, where "B" and blue colors indicate "below-normal" and "A" and orange-red colors indicate "above normal". The darker the shading, the greater is the level of confidence. The numbers labeling the contours separating different shades gives the probability that the indicated category (A, B, or N) will occur.
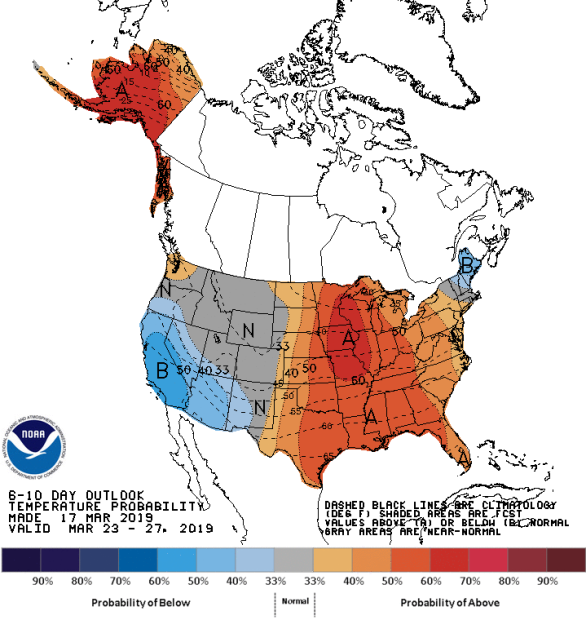
Generally, the probability of below average temperatures (as seen in Figure 7) is moderate over California, western Nevada, Arizona, western New Mexico Northern New England. Confidence is high for above average temperatures over much of the eastern half of the USA, especially over the northern Plains States and Midwest (Minnesota and Wisconsin). Except for those places already mentioned in the West, the remainder of the western half of the USA should experience normal temperatures for this time of the year.
The precipitation outlook for the next 6-10 days (Figure 8) shows a low probability of below average precipitation the coastal regions of the Mid-Atlantic states into New England. In general, the western two-thirds of the country has a moderate probability of above average rainfall, with the highest probabilities over central California, western Nevada, the southern and central Plains states and much of southern Alaska. Generally, other than the aforesaid regions that have a low chance of seeing below average rainfall, the remainder of the eastern third of the USA will experience average precipitation for this time of the year.
Weekly hazards output by the NWS’s Climate prediction center for the next 3-7 days is shown in Figure 9 below.
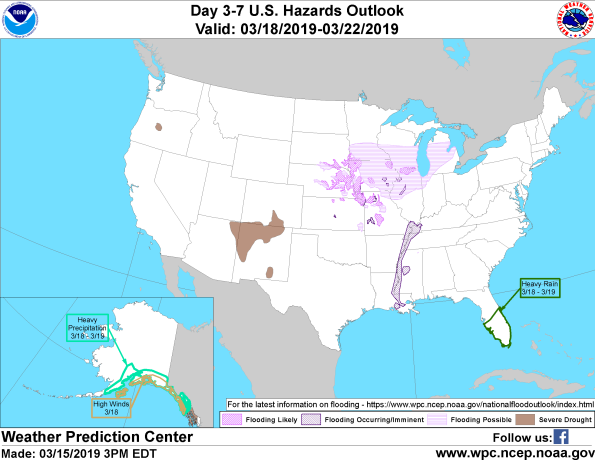
Figure 9 shows that most of the expected weather hazards over the United States in the next 3 to 7 days. A rather quiet period ahead over much of the continental USA. Heavy precipitation and high winds are expected over much of southern and southeastern Alaska between the 18th and 19th March. Heavy rain is possible over the southern half of Florida between the 18th and 19th March. Flooding is possible over a large area over the upper Palins and Midwest including Iowa, much of southern Wisconsin and Minnesota, central Michigan and northern Illinois. Flooding is likely over parts of eastern Nebraska, northwestern Missouri and far western Iowa. Flooding is currently occurring over much of the central and southern Mississippi River from Kentucky southwards into Louisiana.